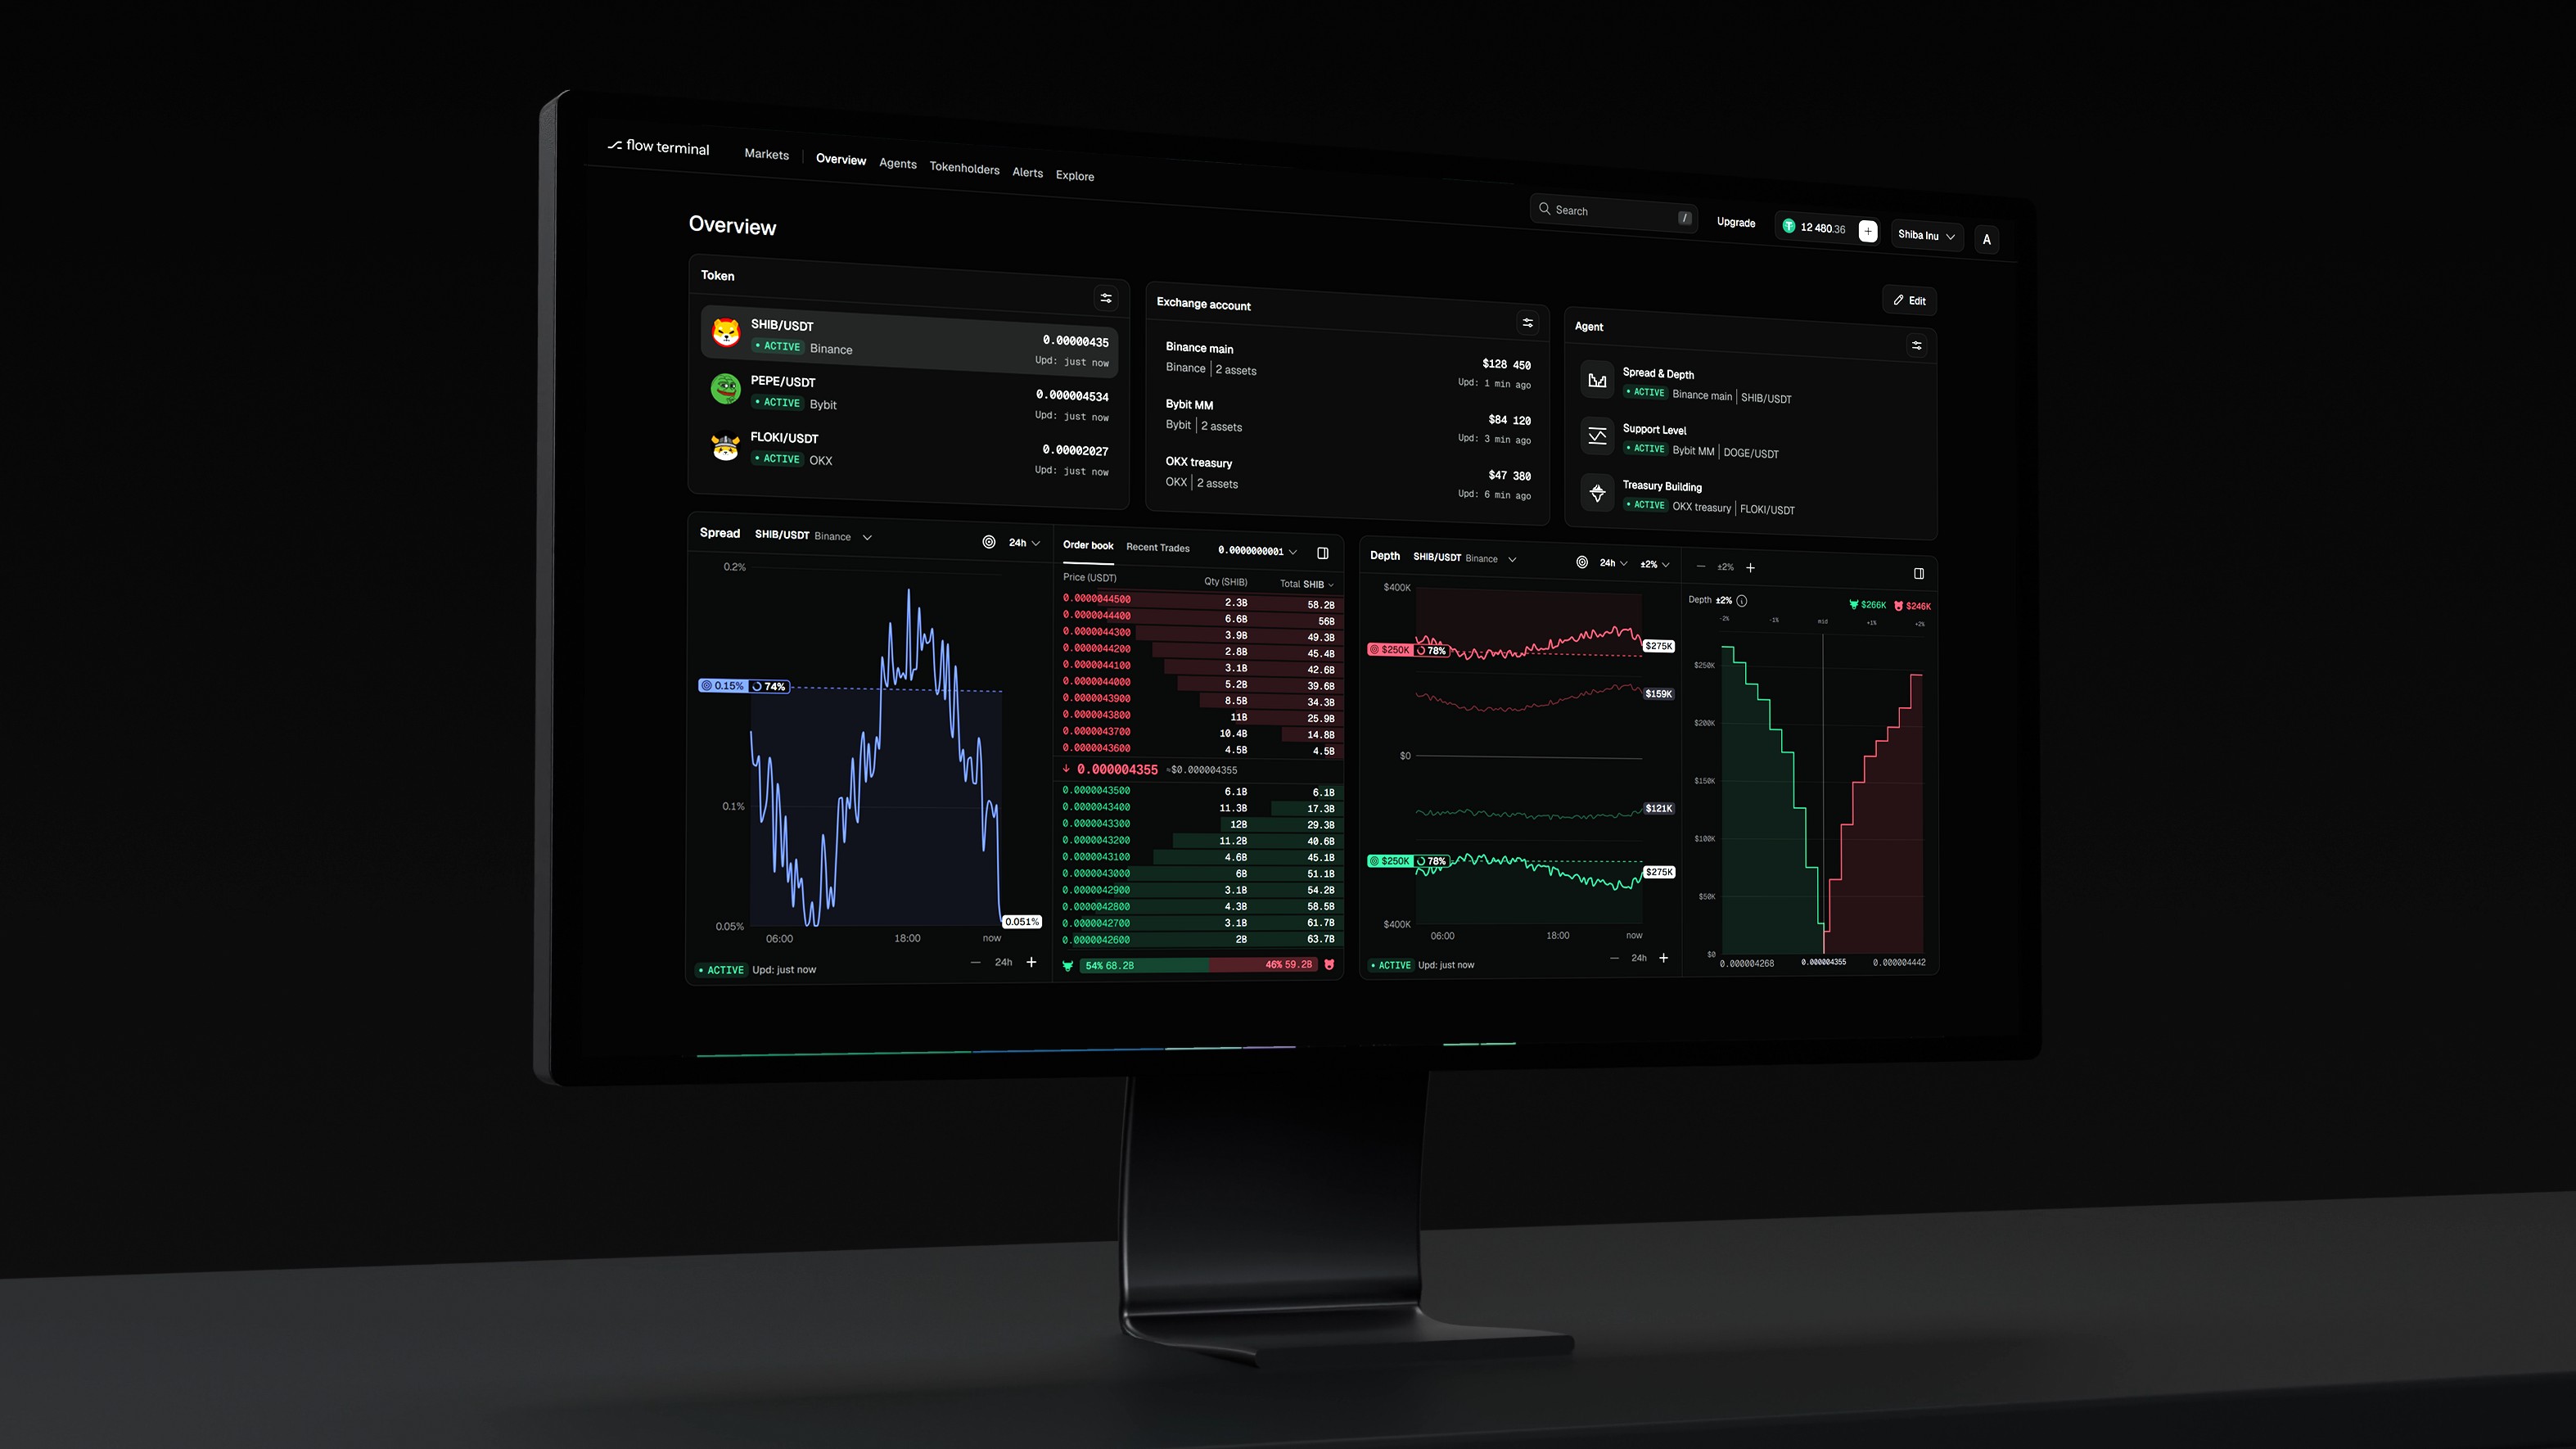
Overview
Every chart in Flow Terminal is a widget: on Overview, on Explore and on every agent's page. They run on live order books pulled straight from the exchanges. I designed the widgets and the layout they live in, and built both after I took over the frontend in July 2026.
Outcome
I'd count the teams that see a number out of target and start the agent that fixes it.
The team picks the charts
The first Overview was three fixed sections we chose for every team: holders, average balance and sell pressure. Every team got the same three, whatever its token needed.
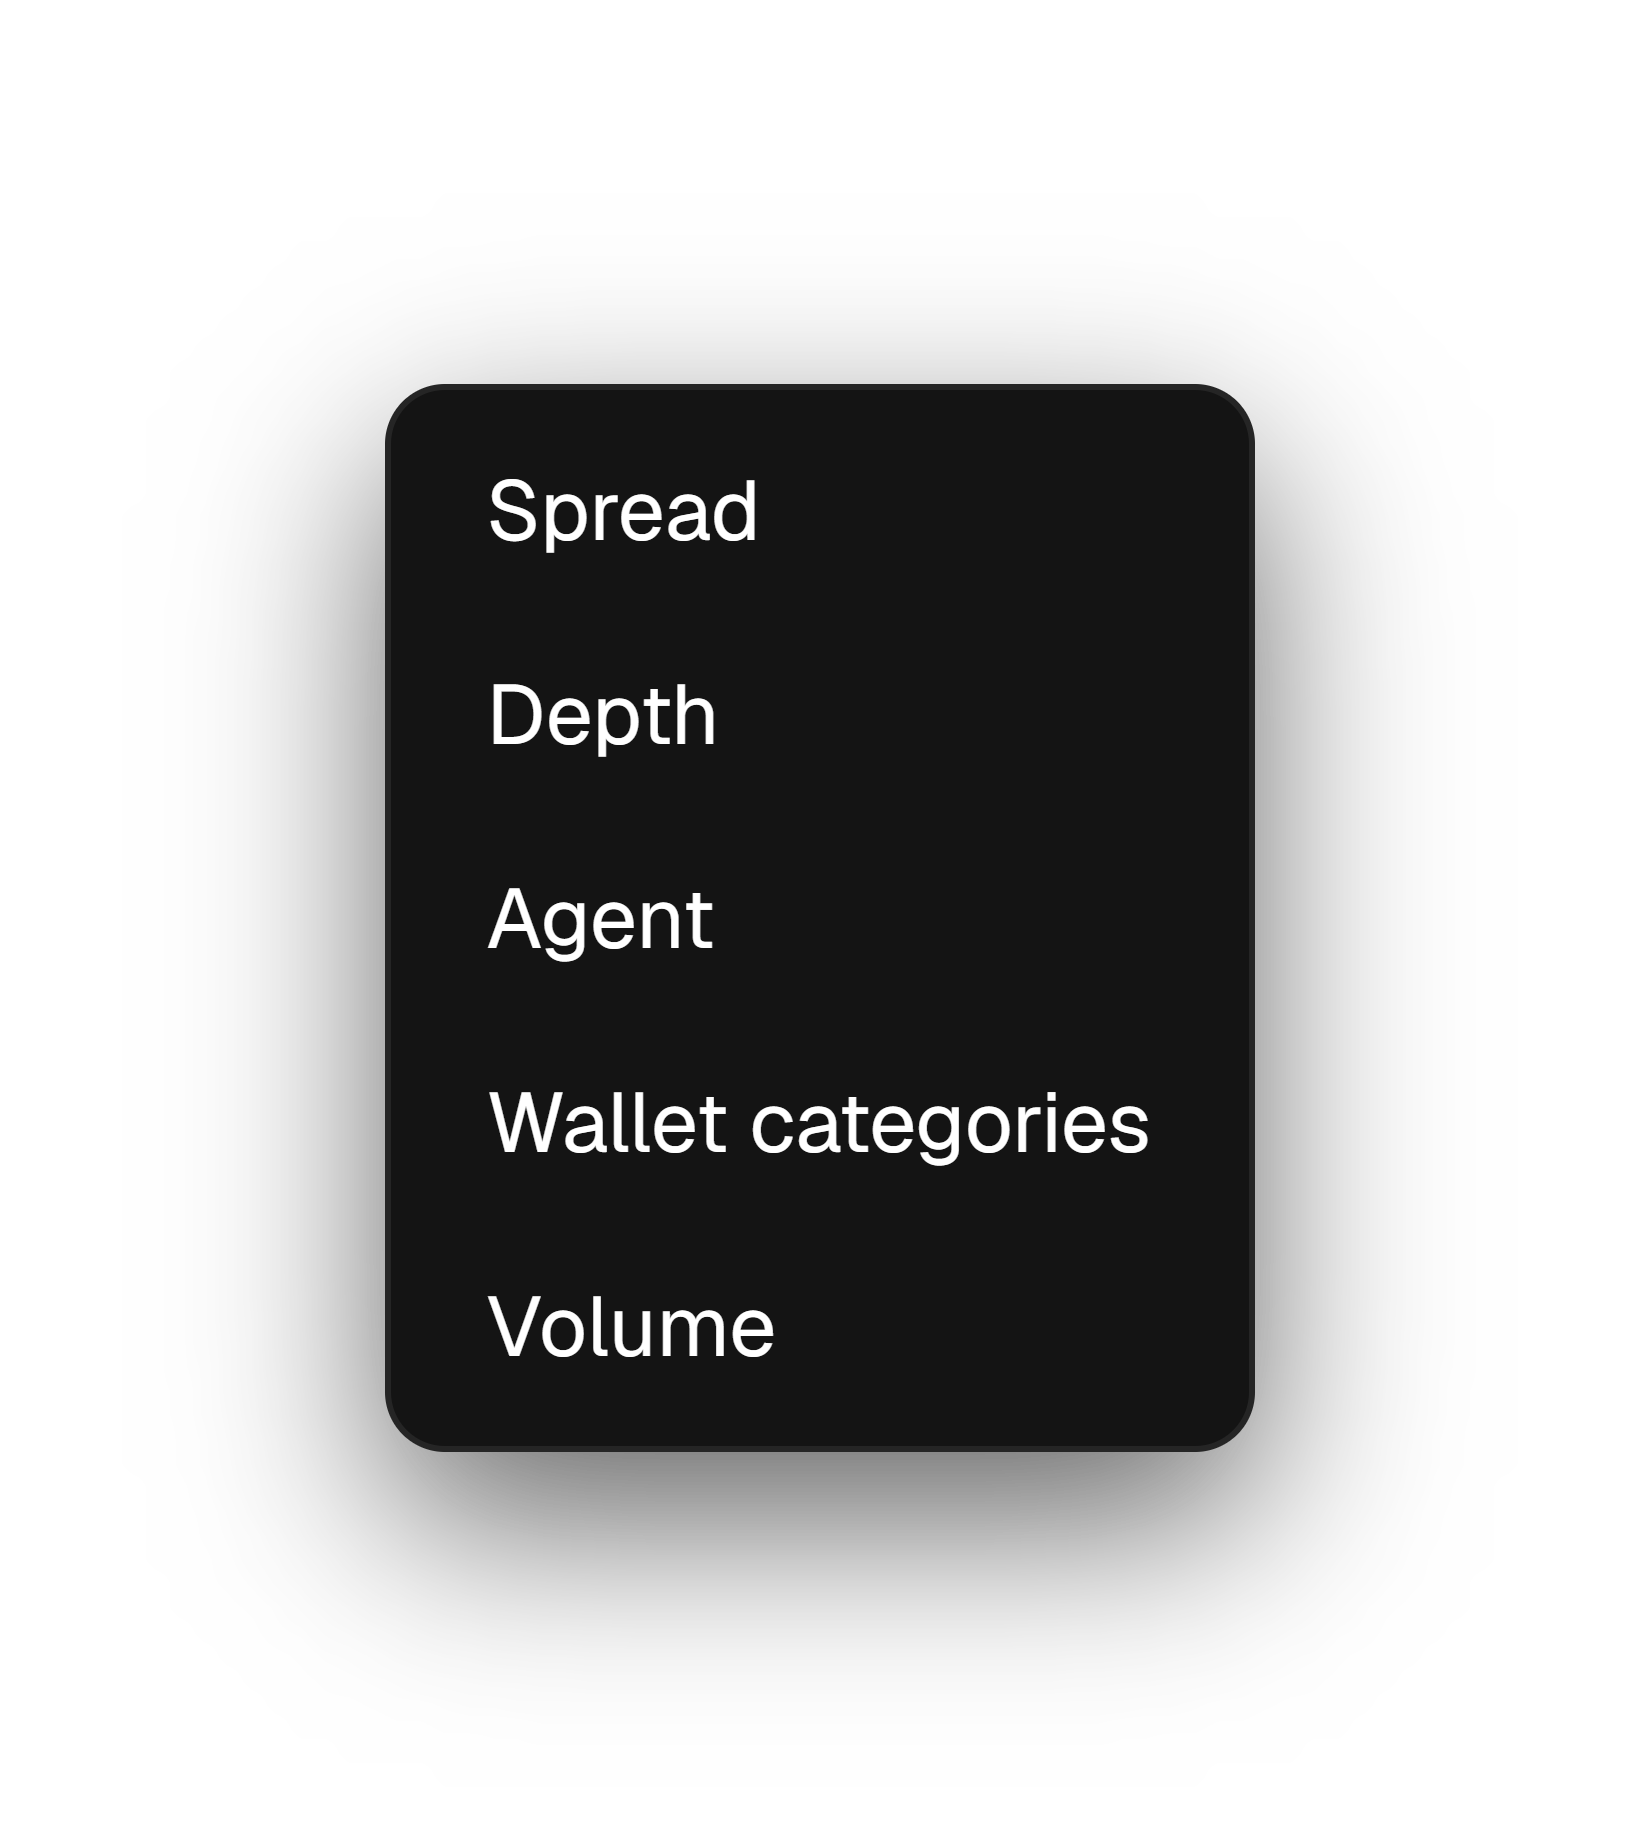
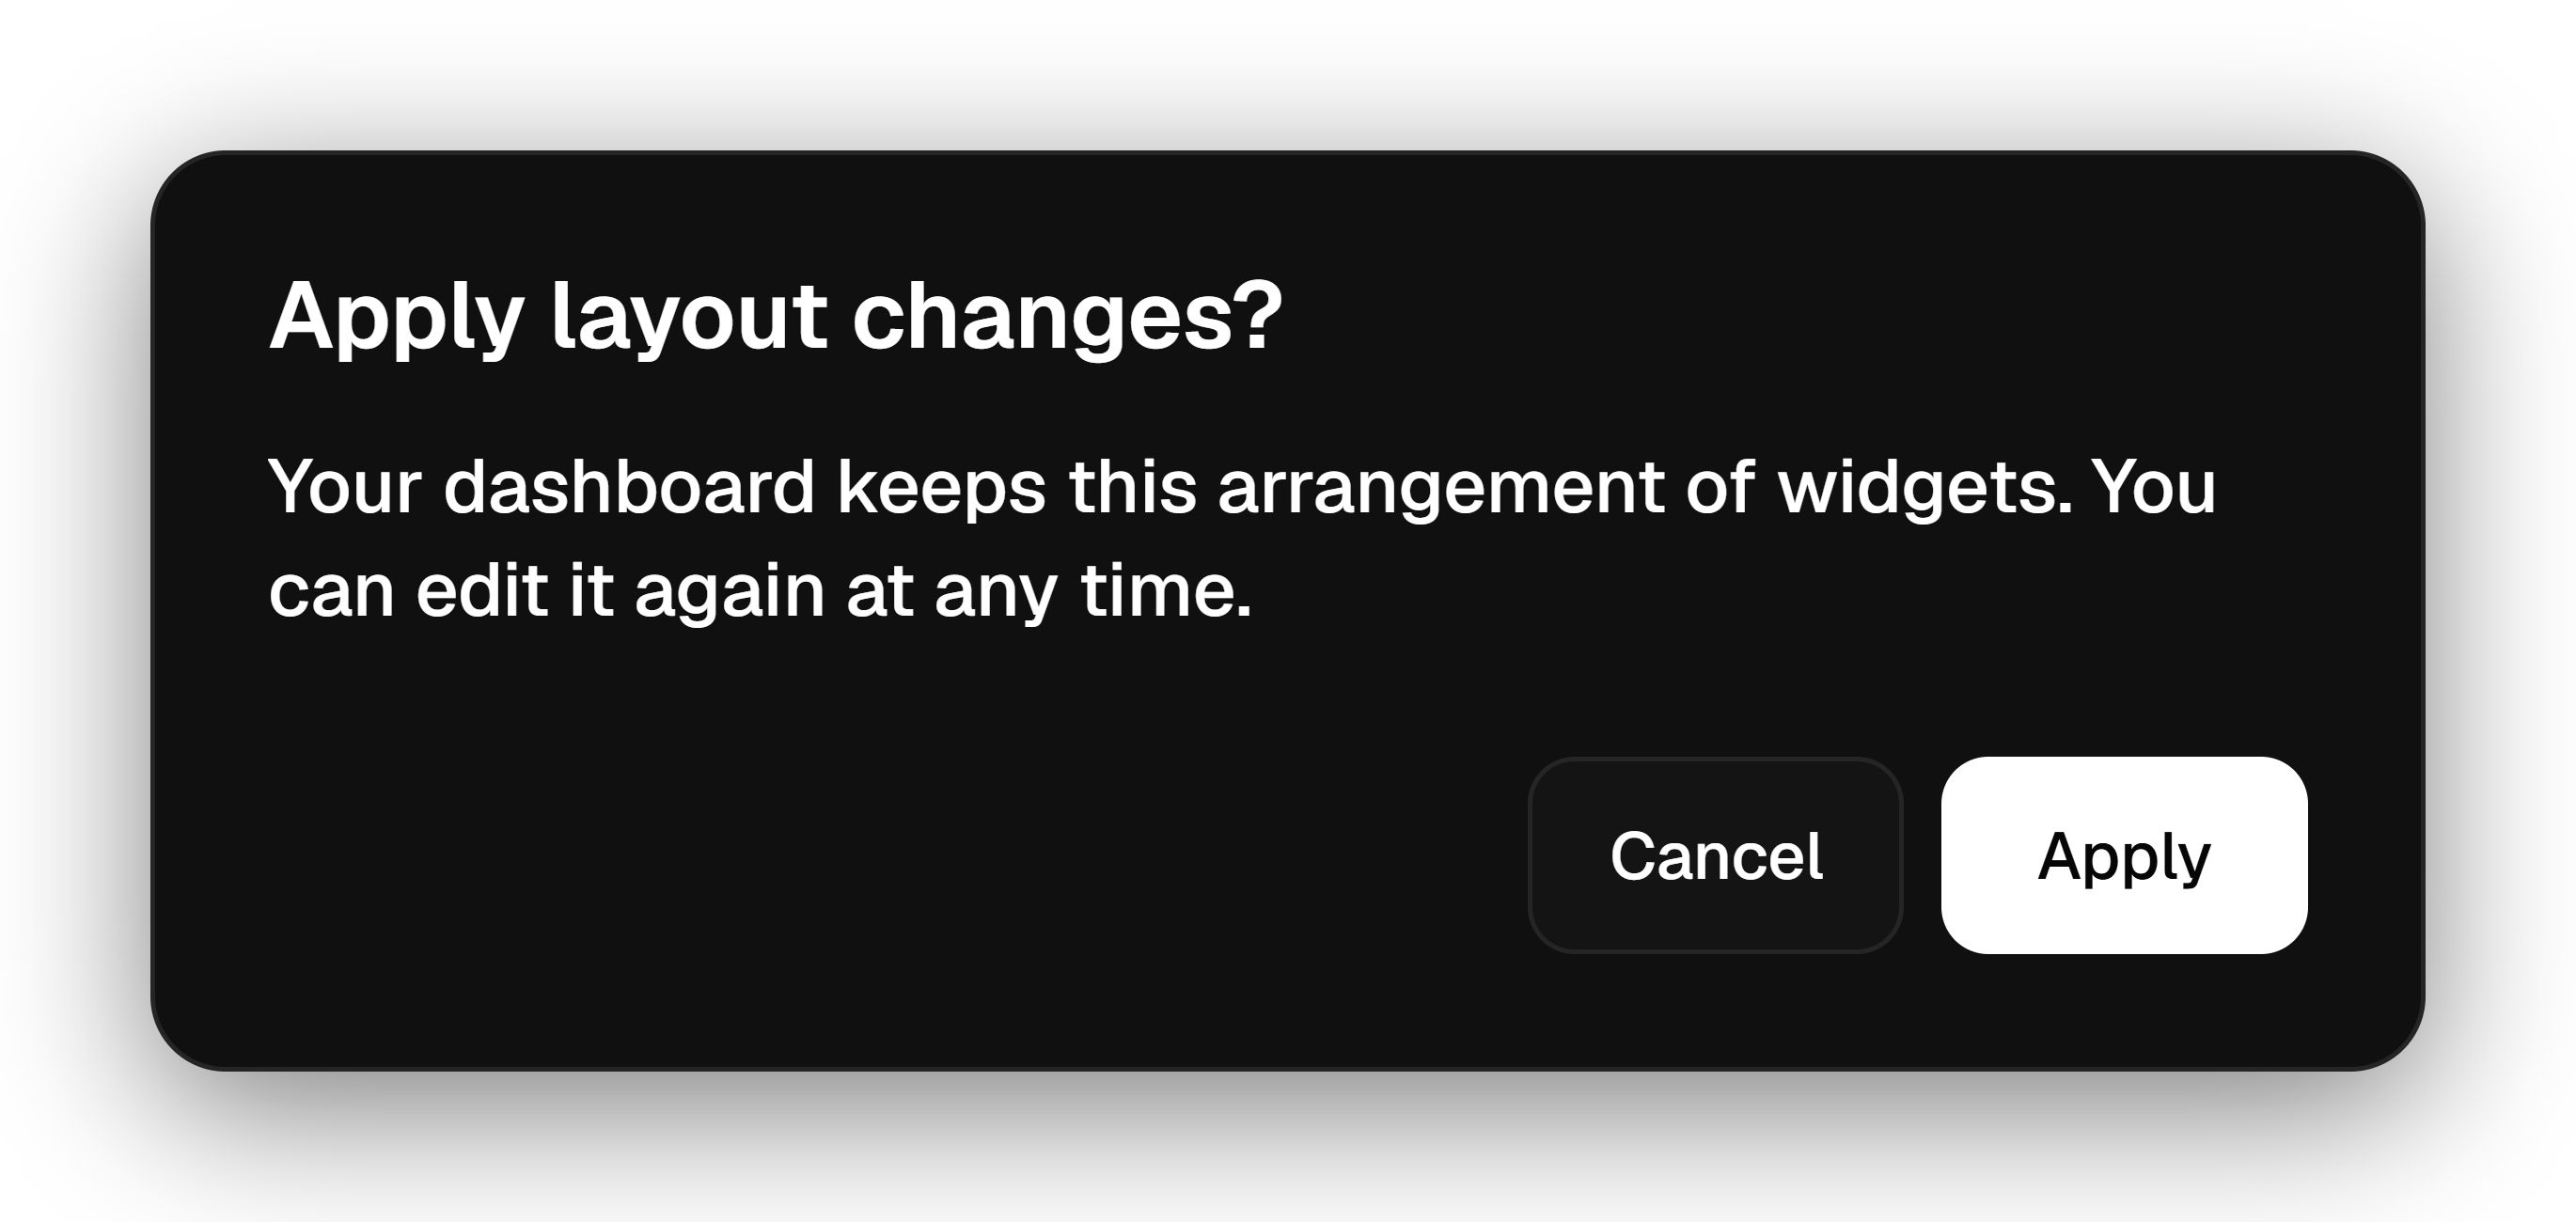
Now the team builds it. Overview is rows of widgets: add one, drag it to another row, change a row's height or how its widgets share the width. Nothing changes until you press Save.
Rows can't overlap or leave a gap, so any layout a team makes still lines up. The layout and each widget's settings are saved to the account, so the team sees the same Overview on any device.
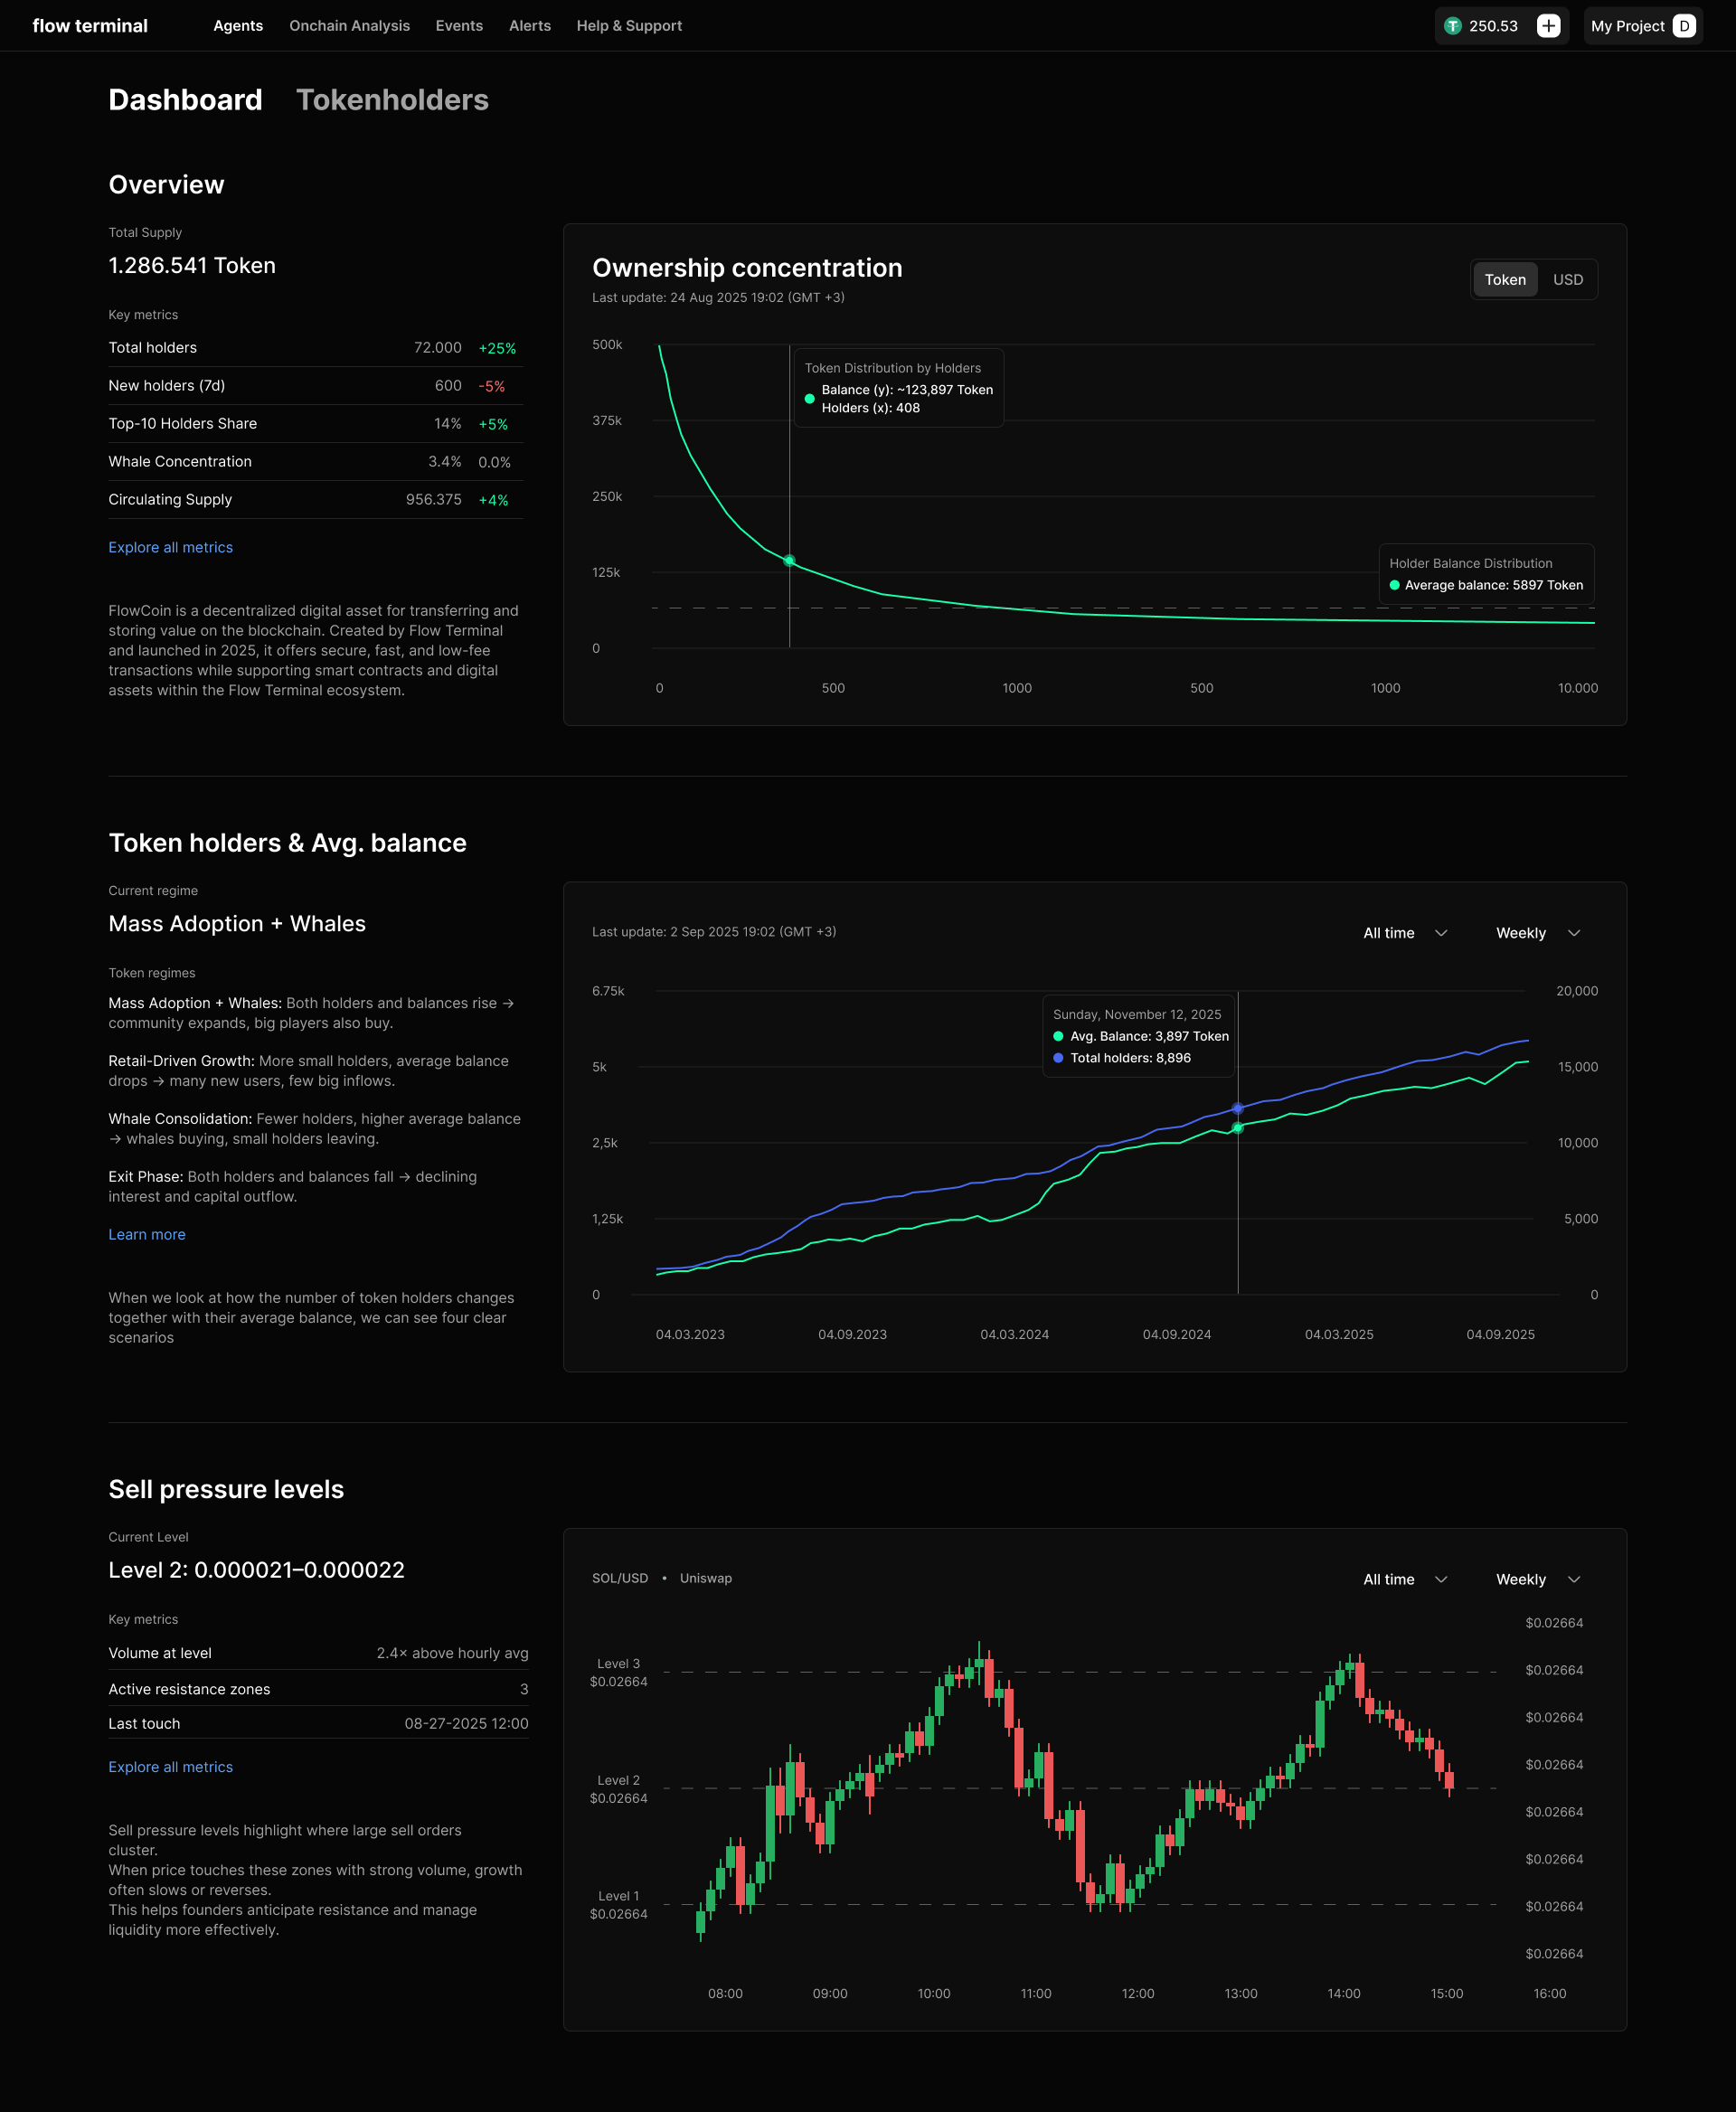
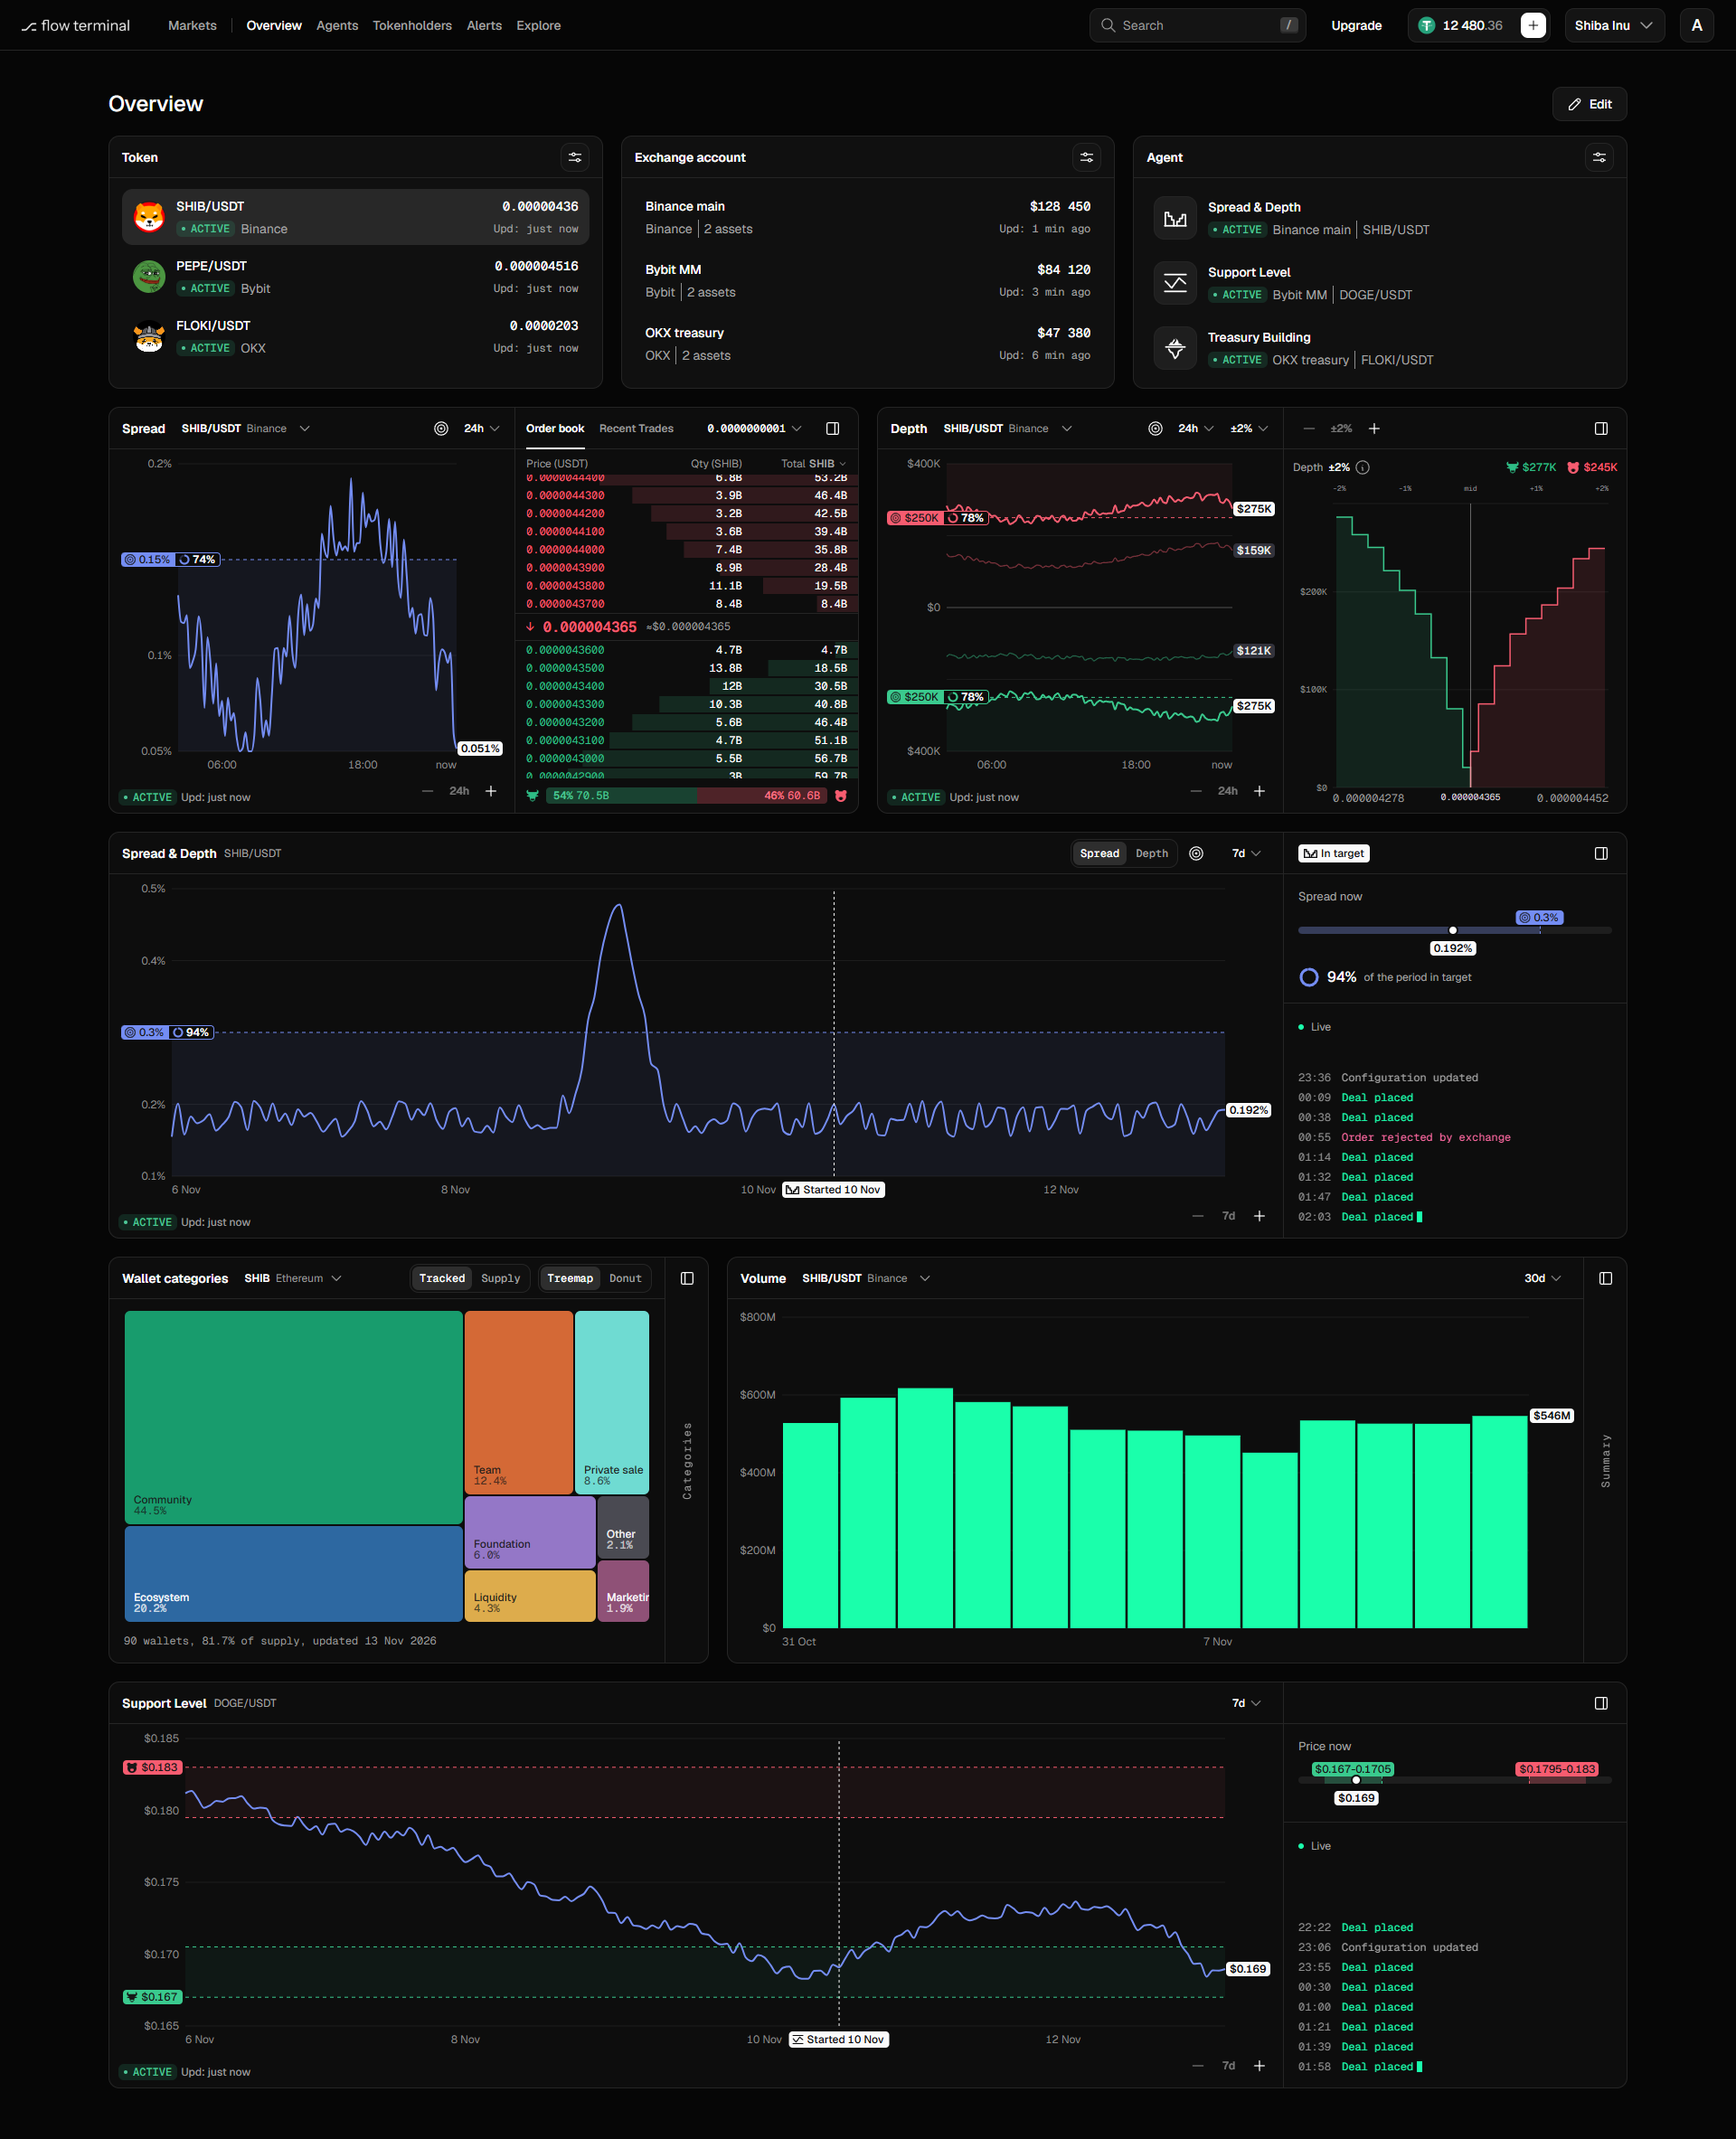
Seen at a glance
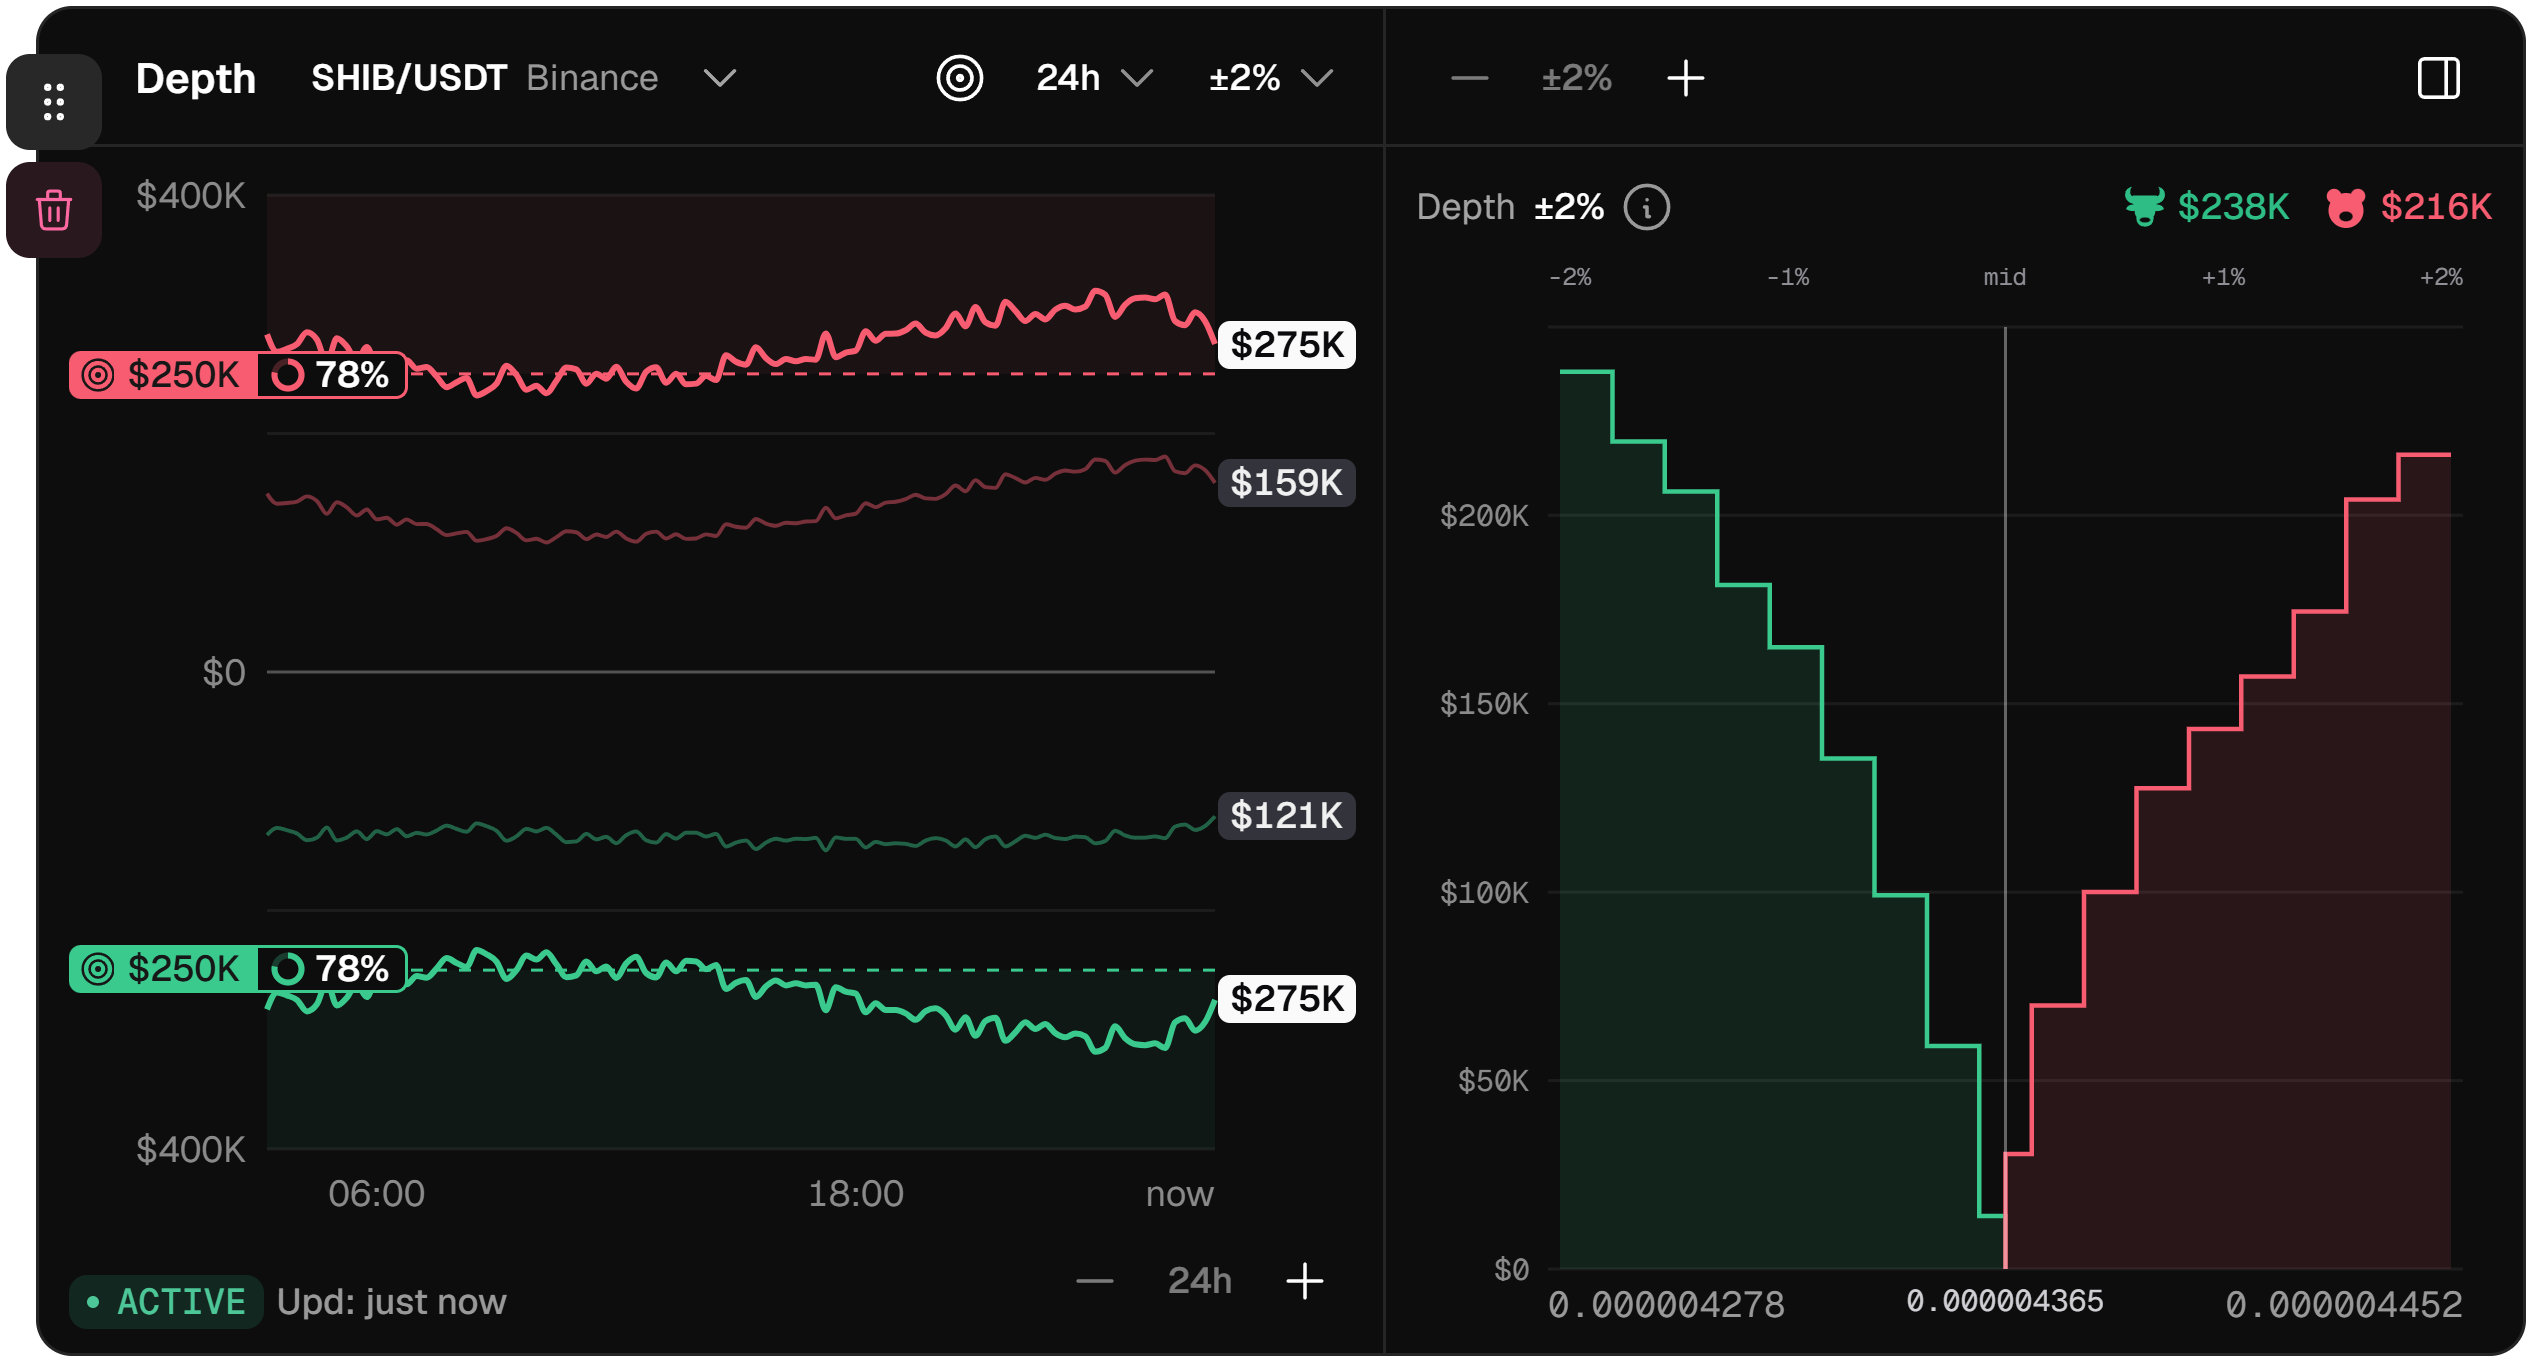
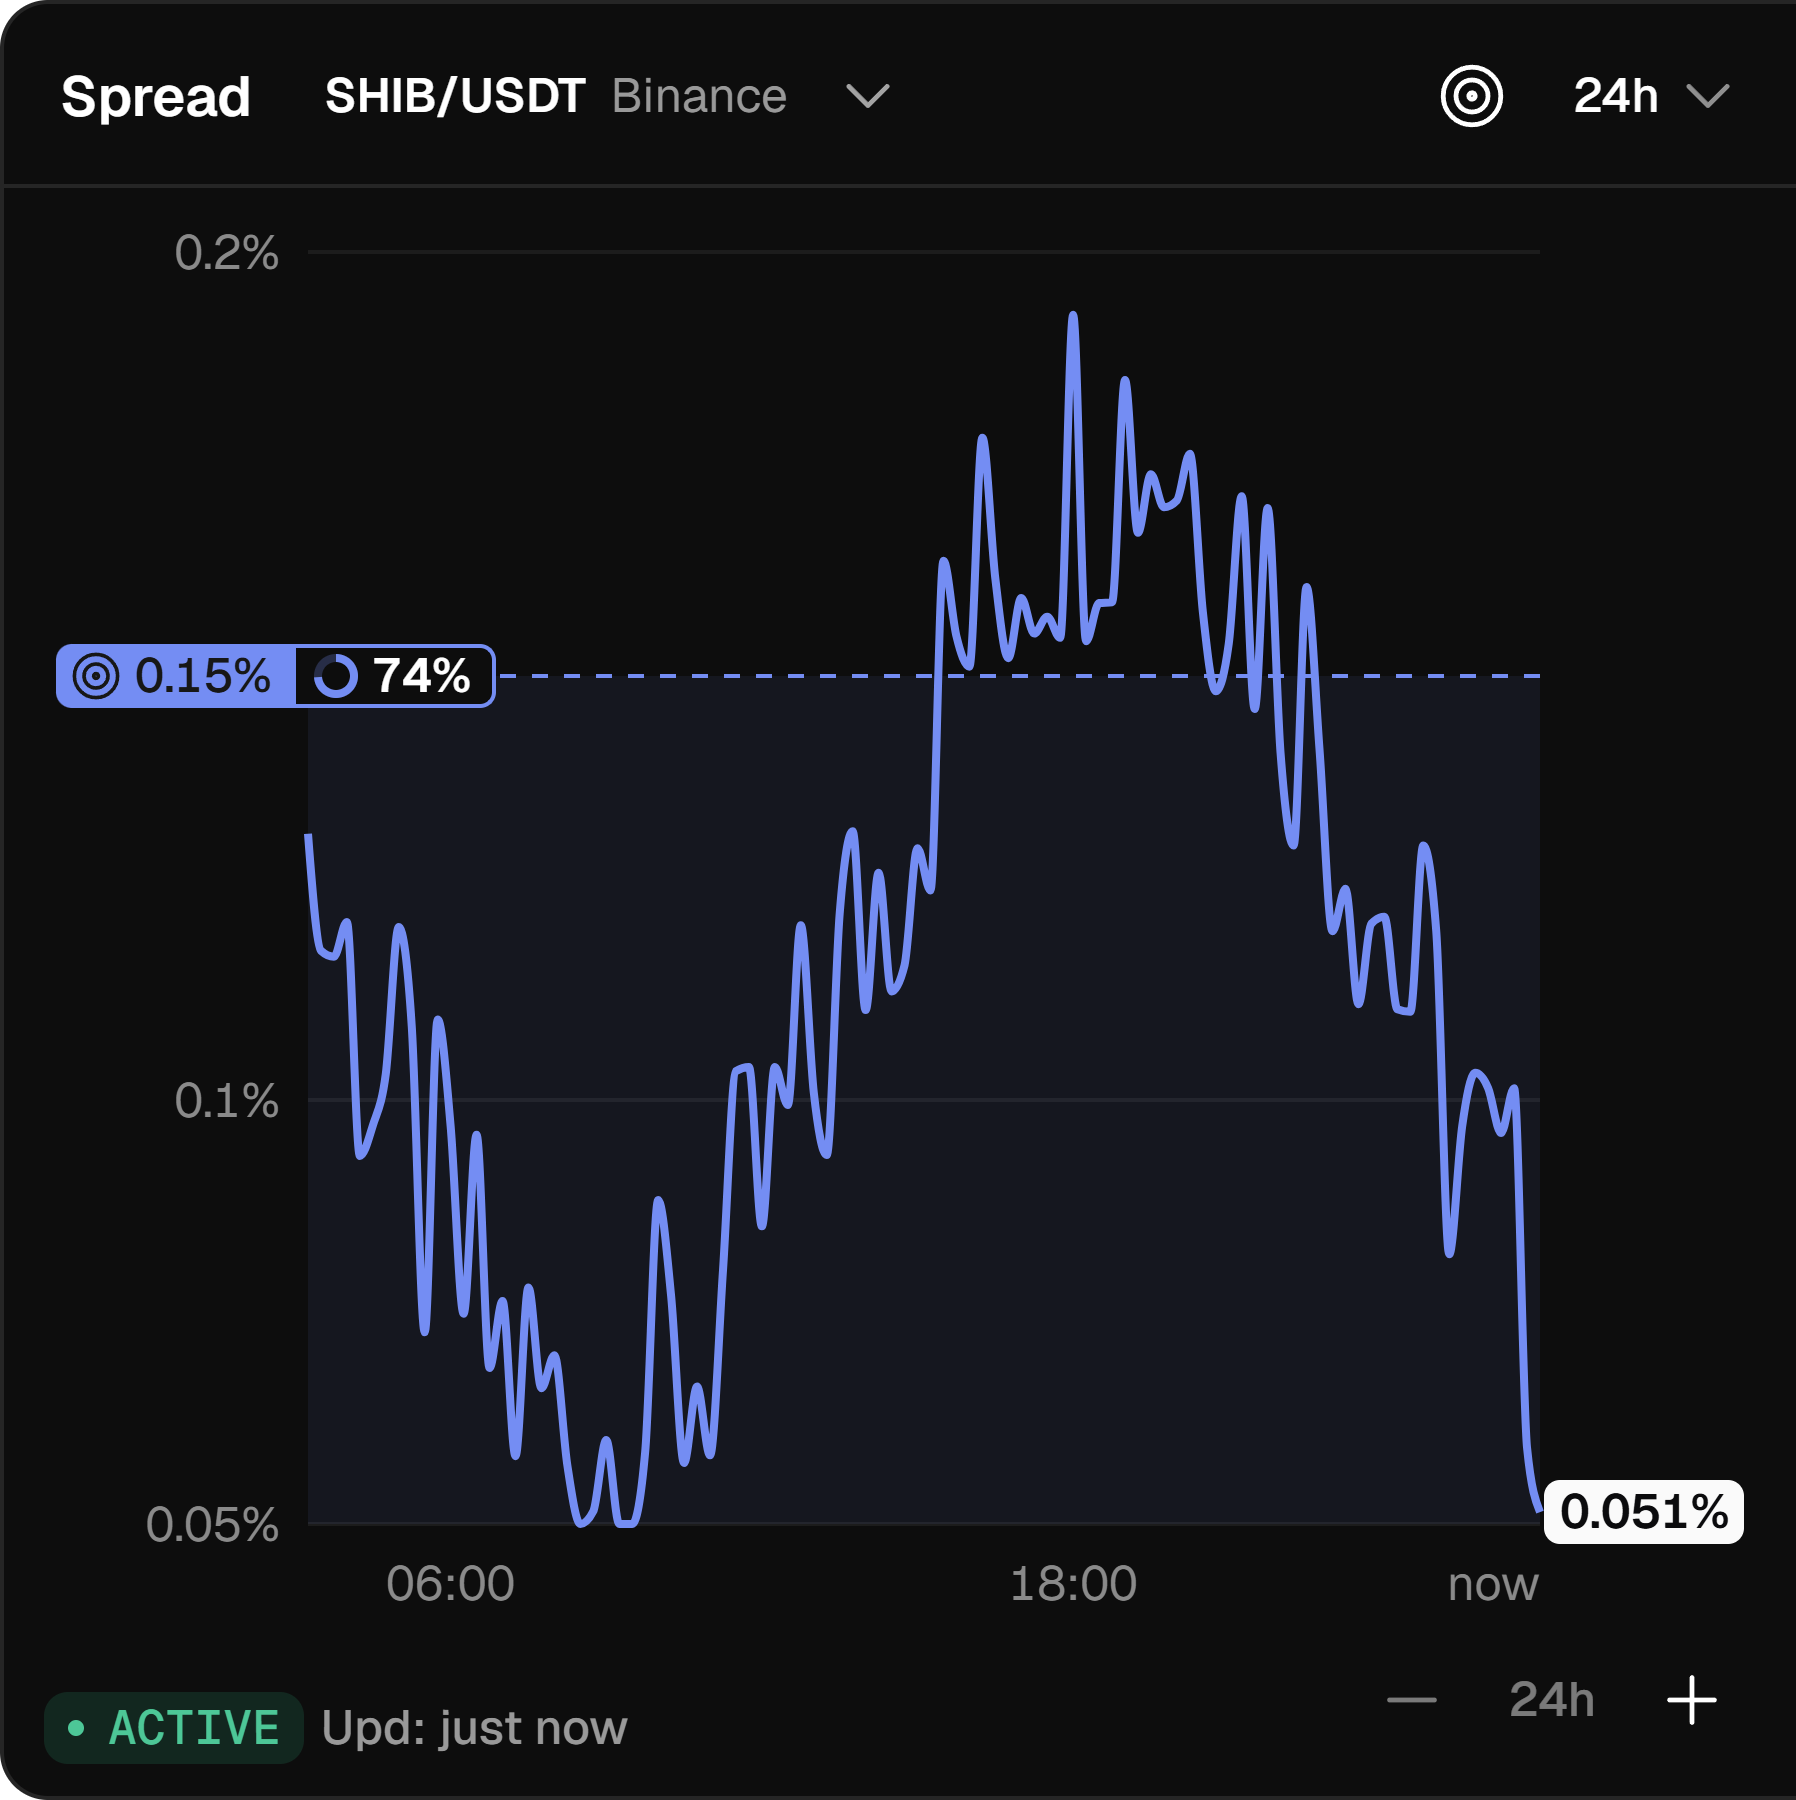
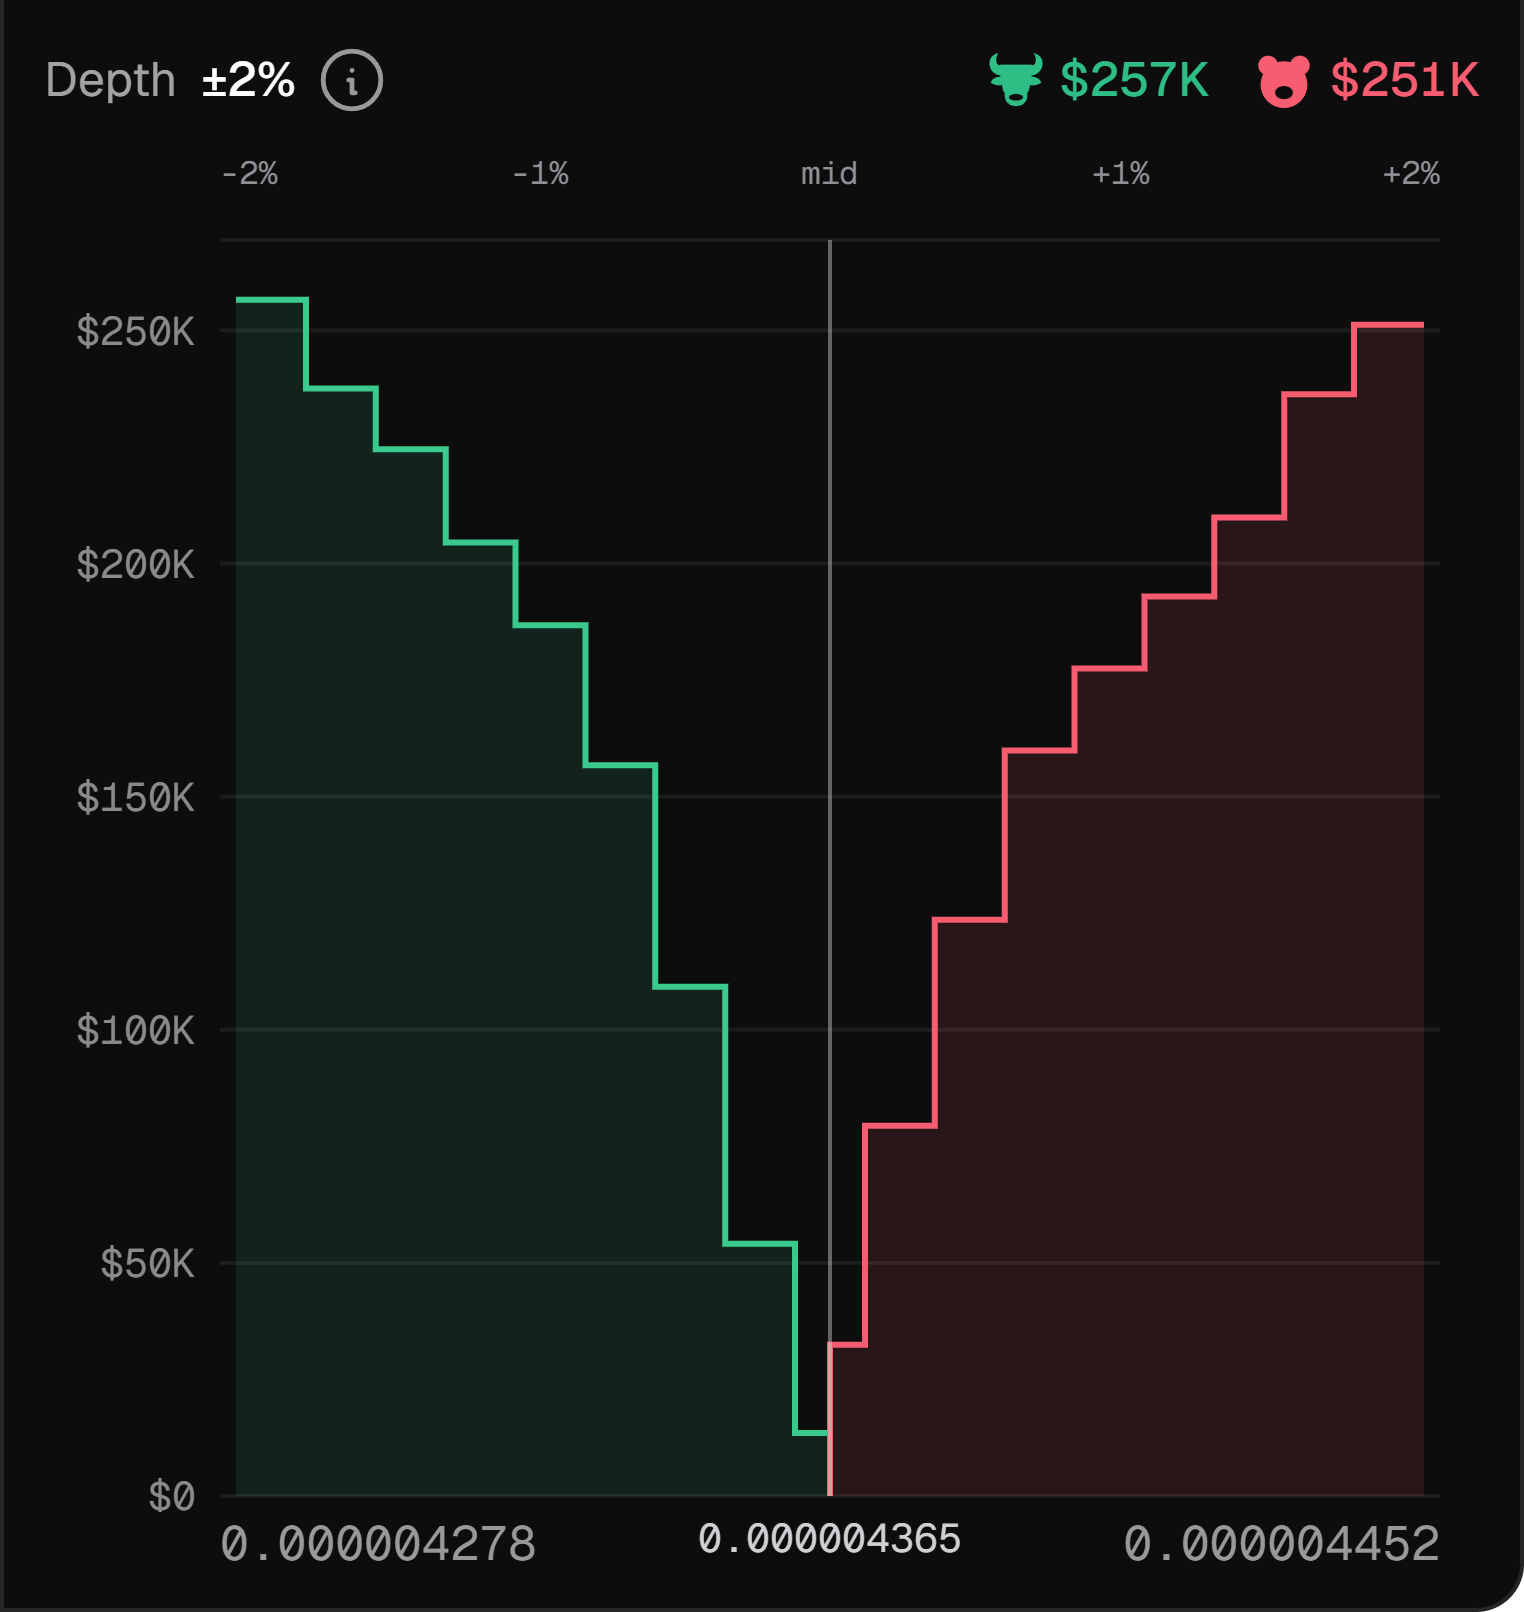
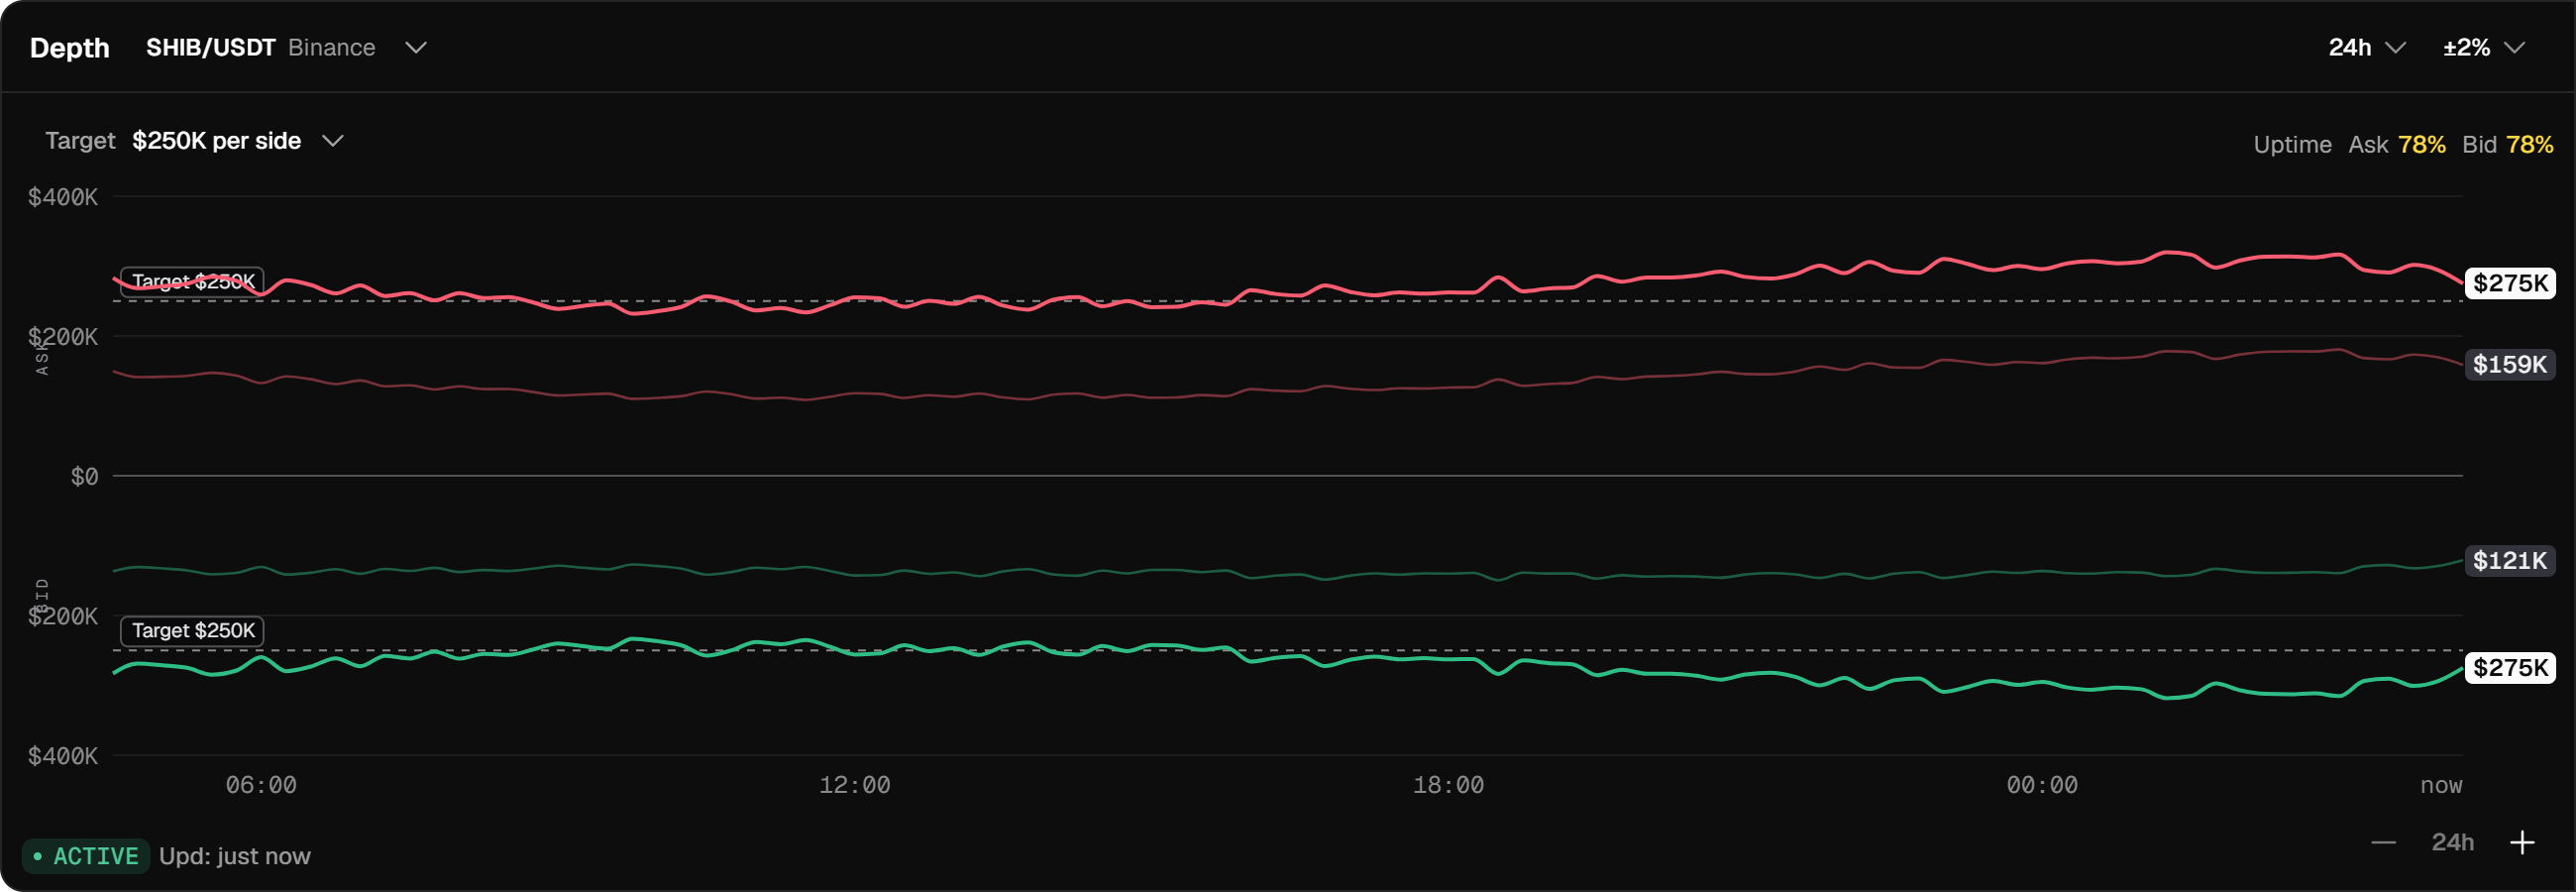
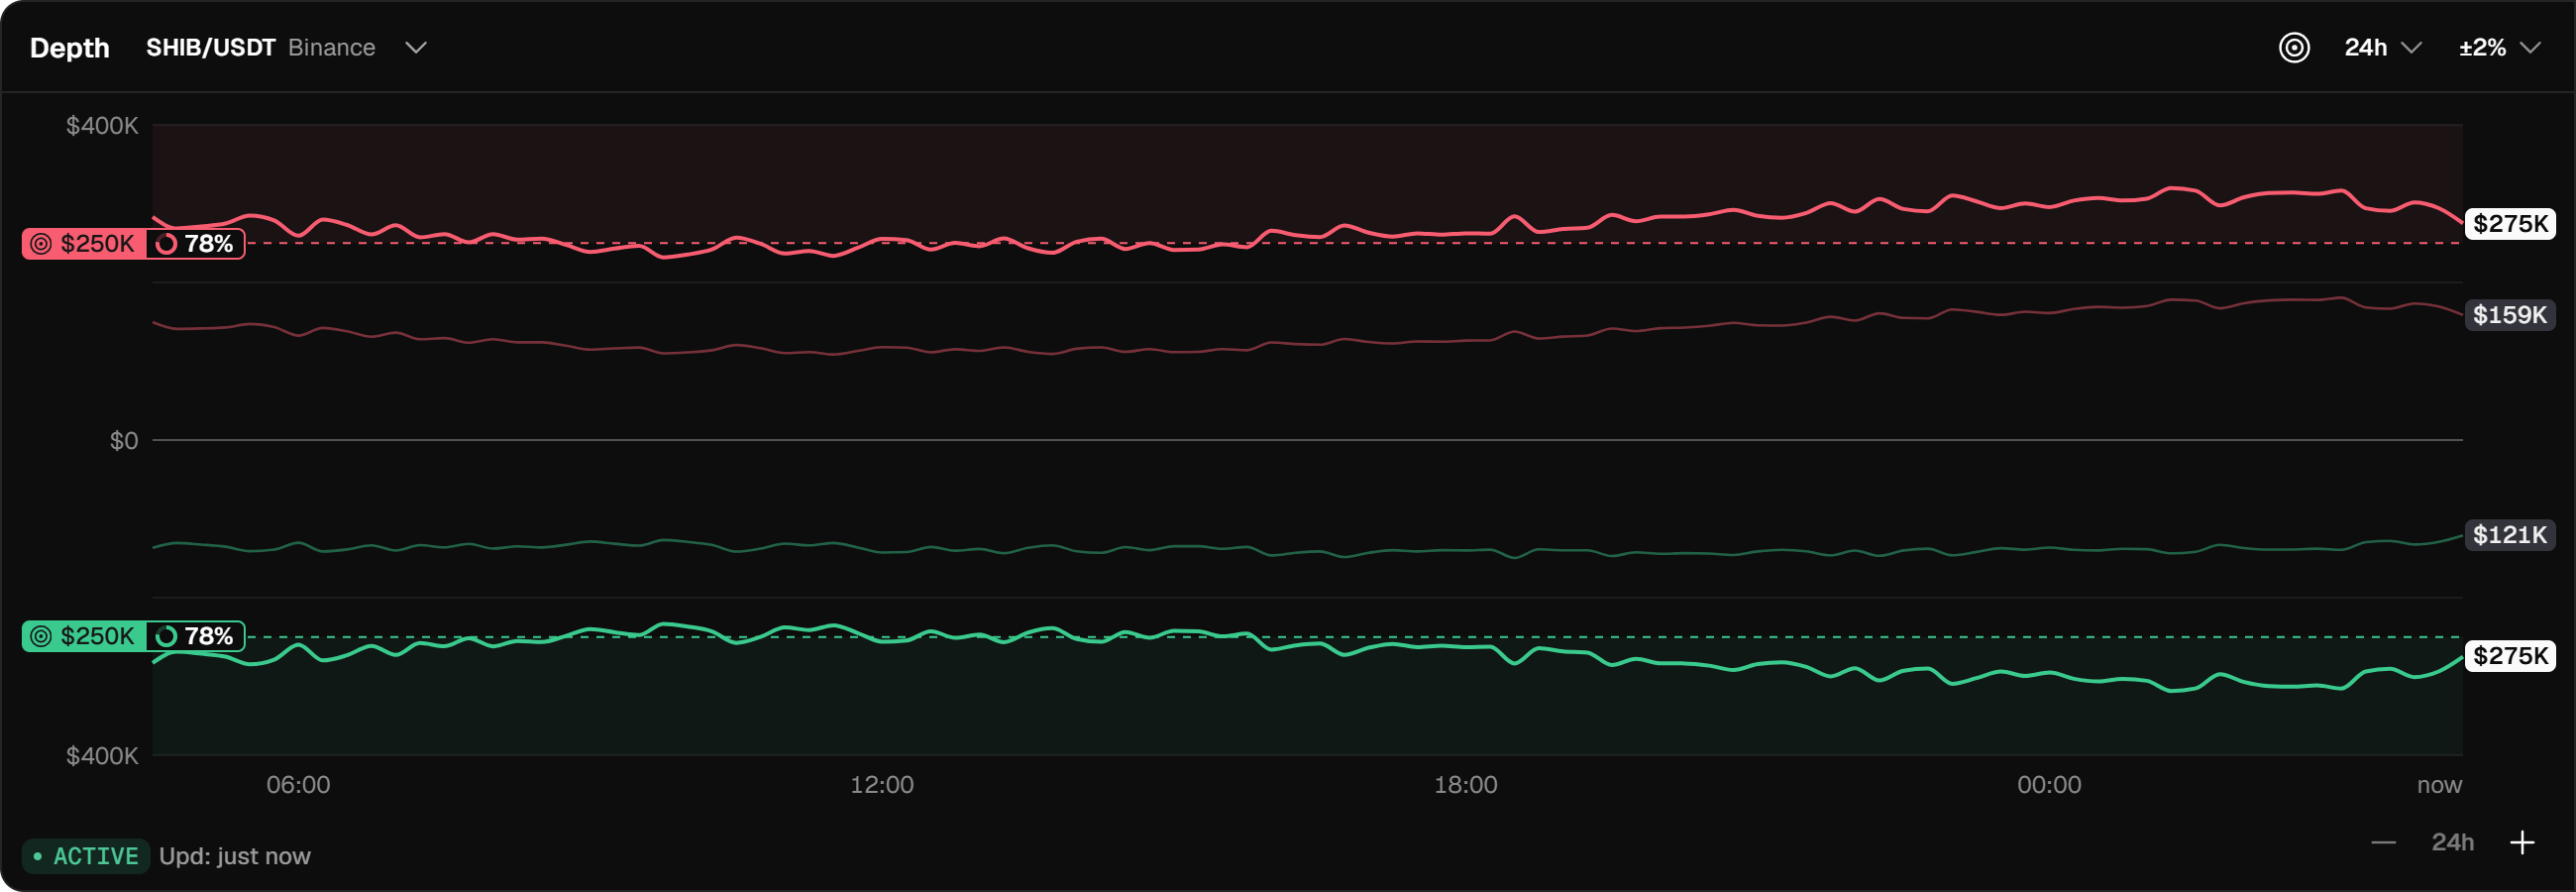
Spread and depth are what a token team pays a market maker for. Spread is the gap between the best buy and sell price. Depth is how much money sits in the book near the price. Each has a target.
In the earlier version the target, its uptime and an "out of target" tag sat in a row above the chart, and you had to read it to know where you stood.
I moved the target into the header and gave that row back to the chart. Target and uptime now share one pill on the axis, and the line itself shows whether you're in or out, so the tag went away.
Bid and ask became a bull and a bear: a widget this dense has few pixels to spare, and an icon takes less room than a word. Depth is mirrored around zero with sells on top, because a bear presses the price down and a bull pushes it up.
I checked the numbers against Binance's own order book: $6.70M of asks within 1% on Binance, $6.65M in the widget.
The agent page is about the agent
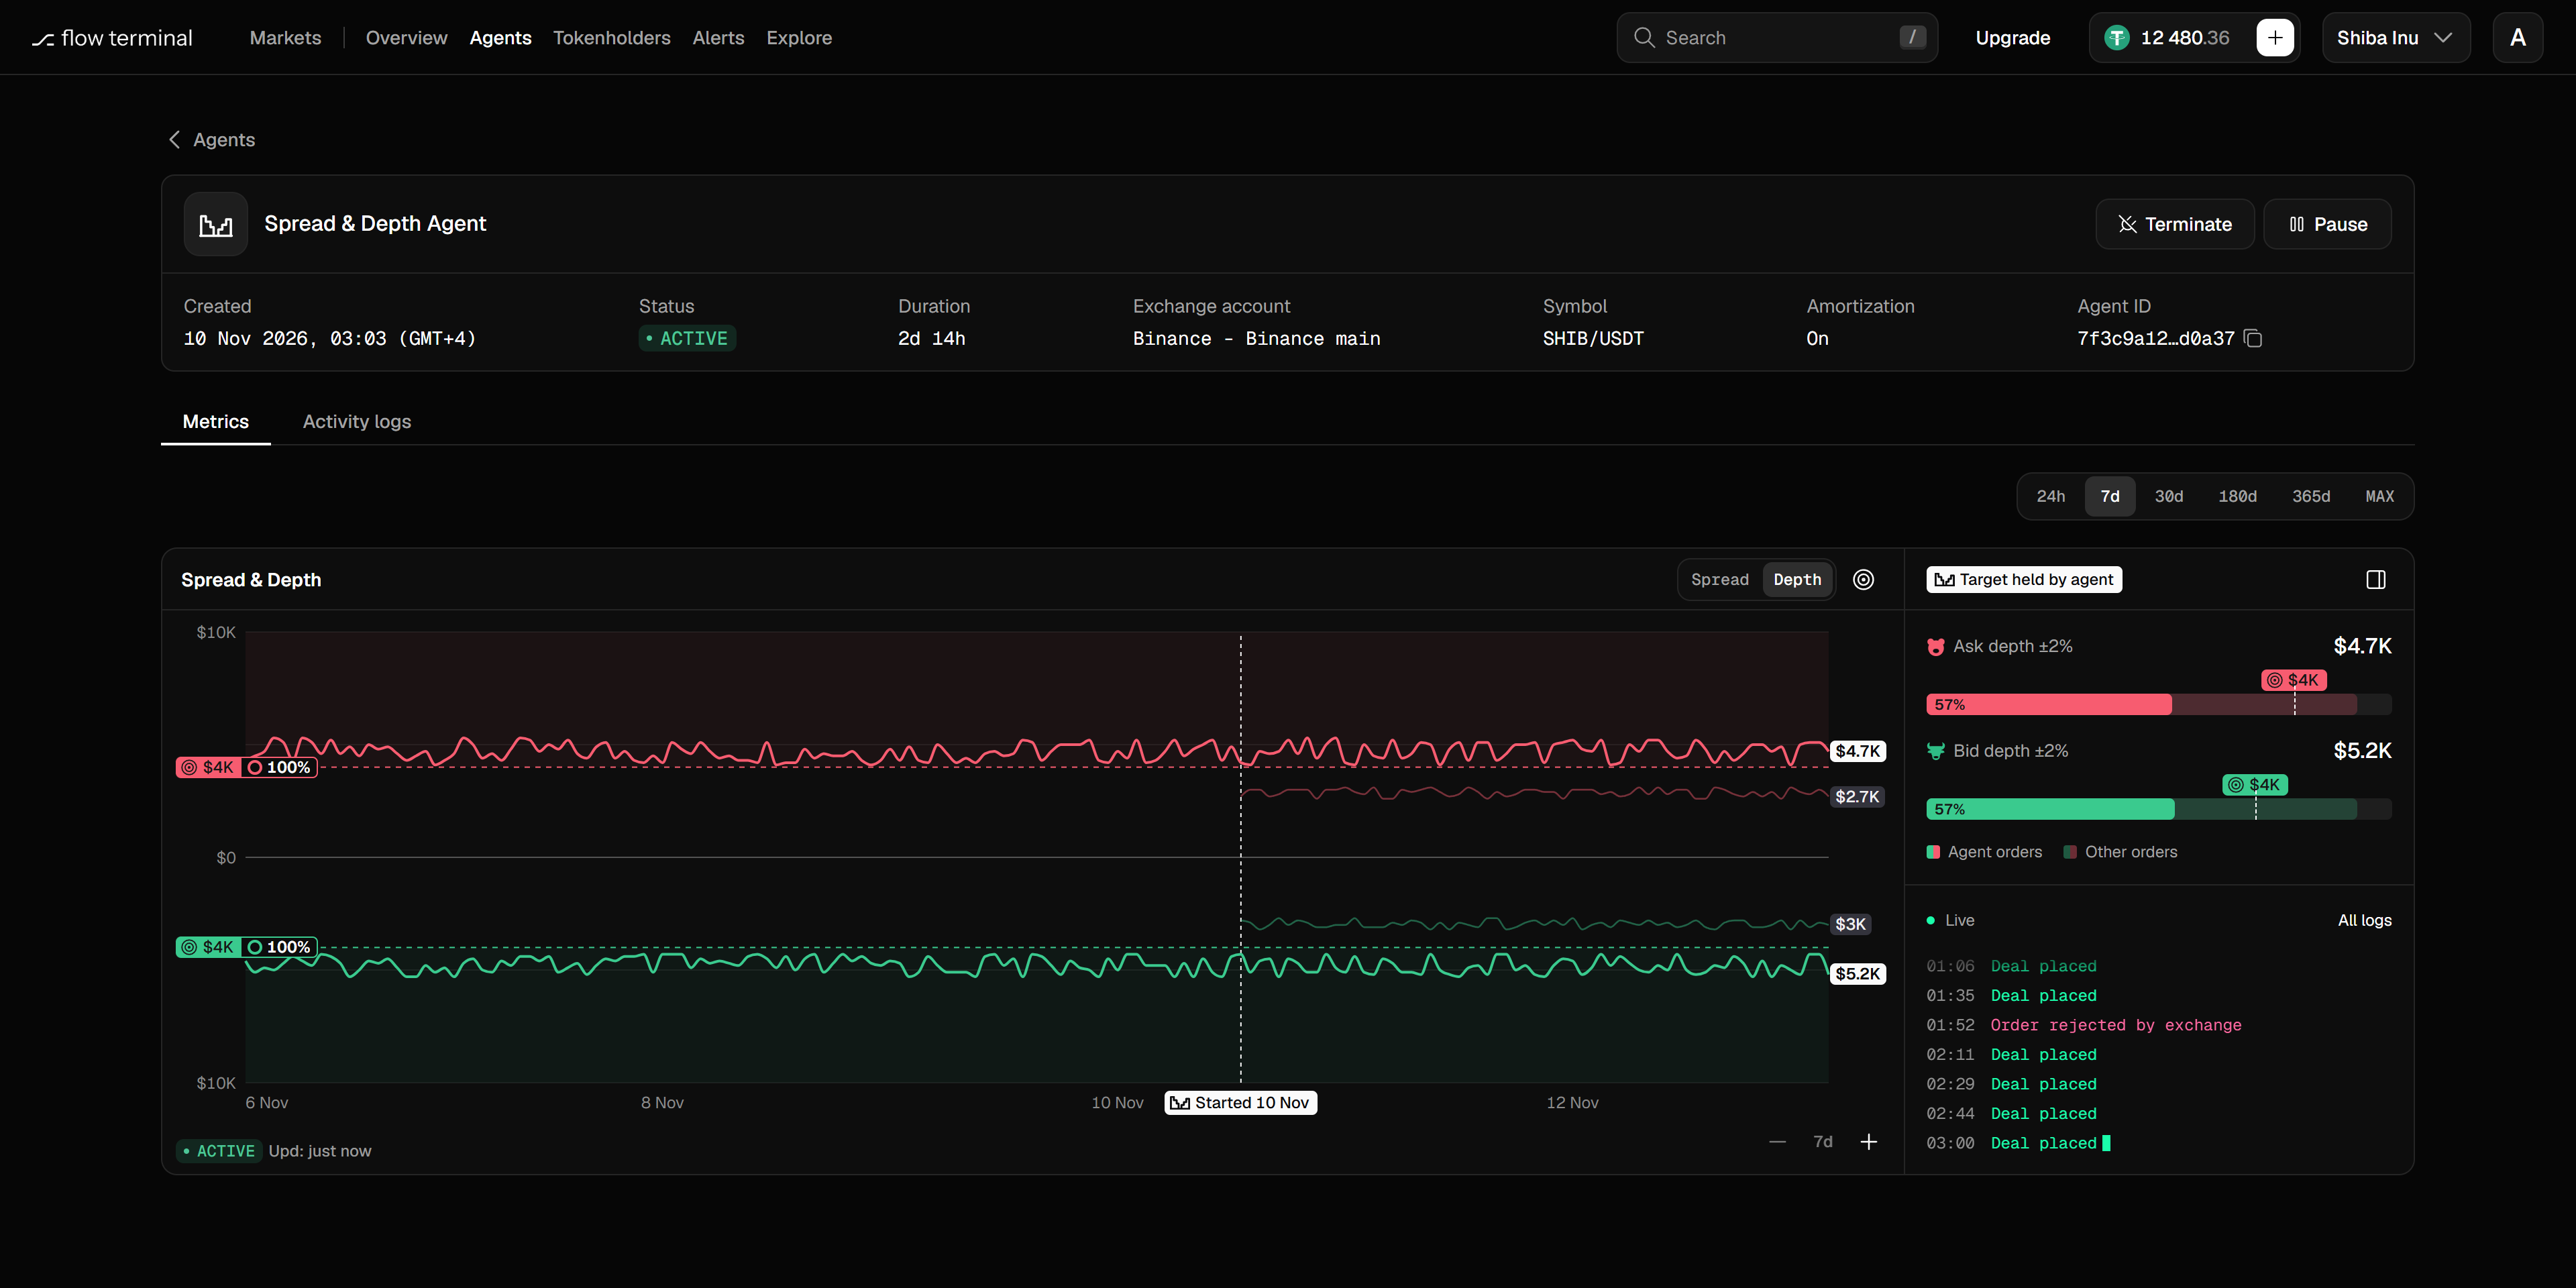
We first planned the agent page as one more Overview and dropped it. People open an agent to see what it did, and the market around it is already on Overview.
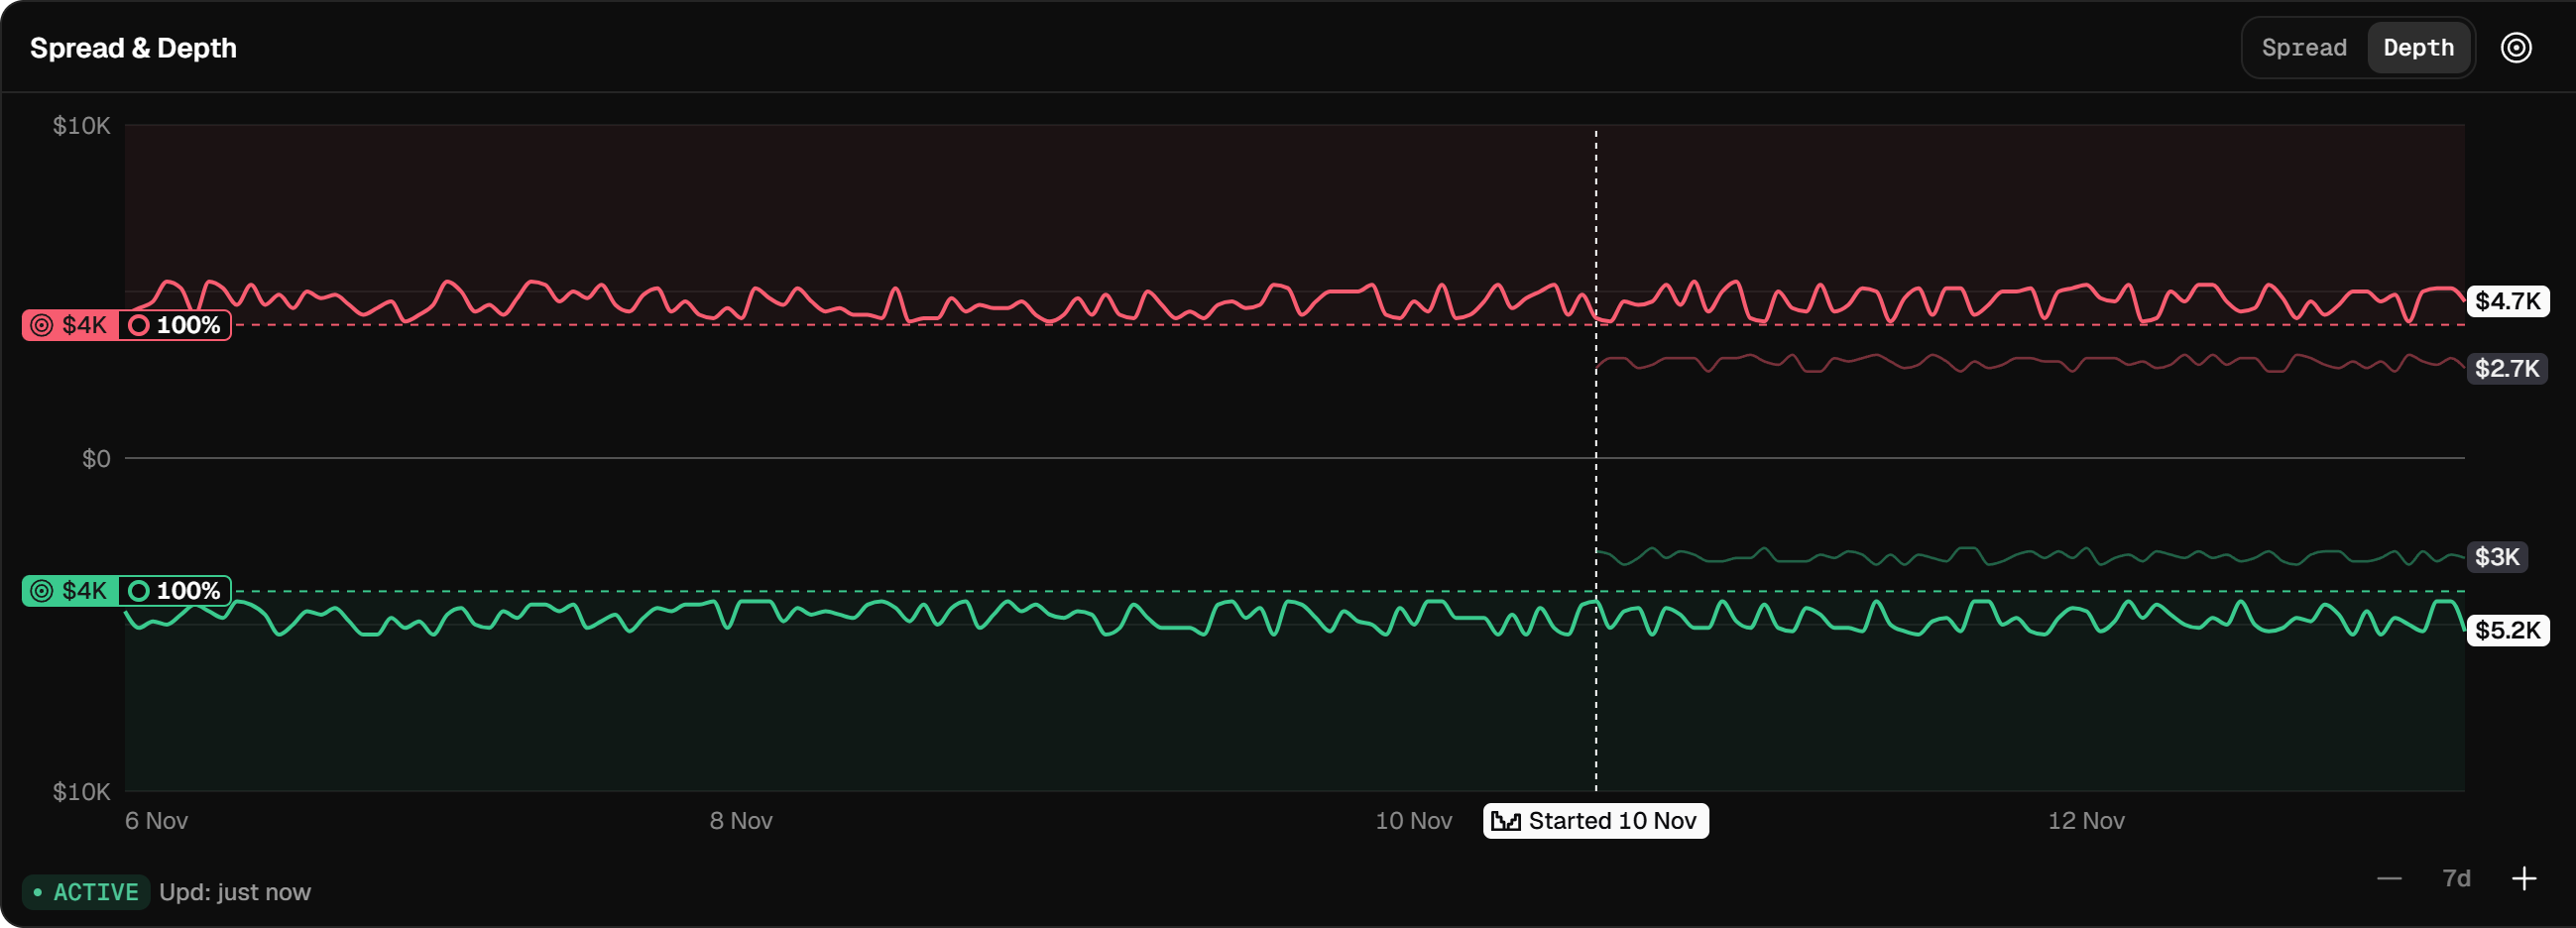
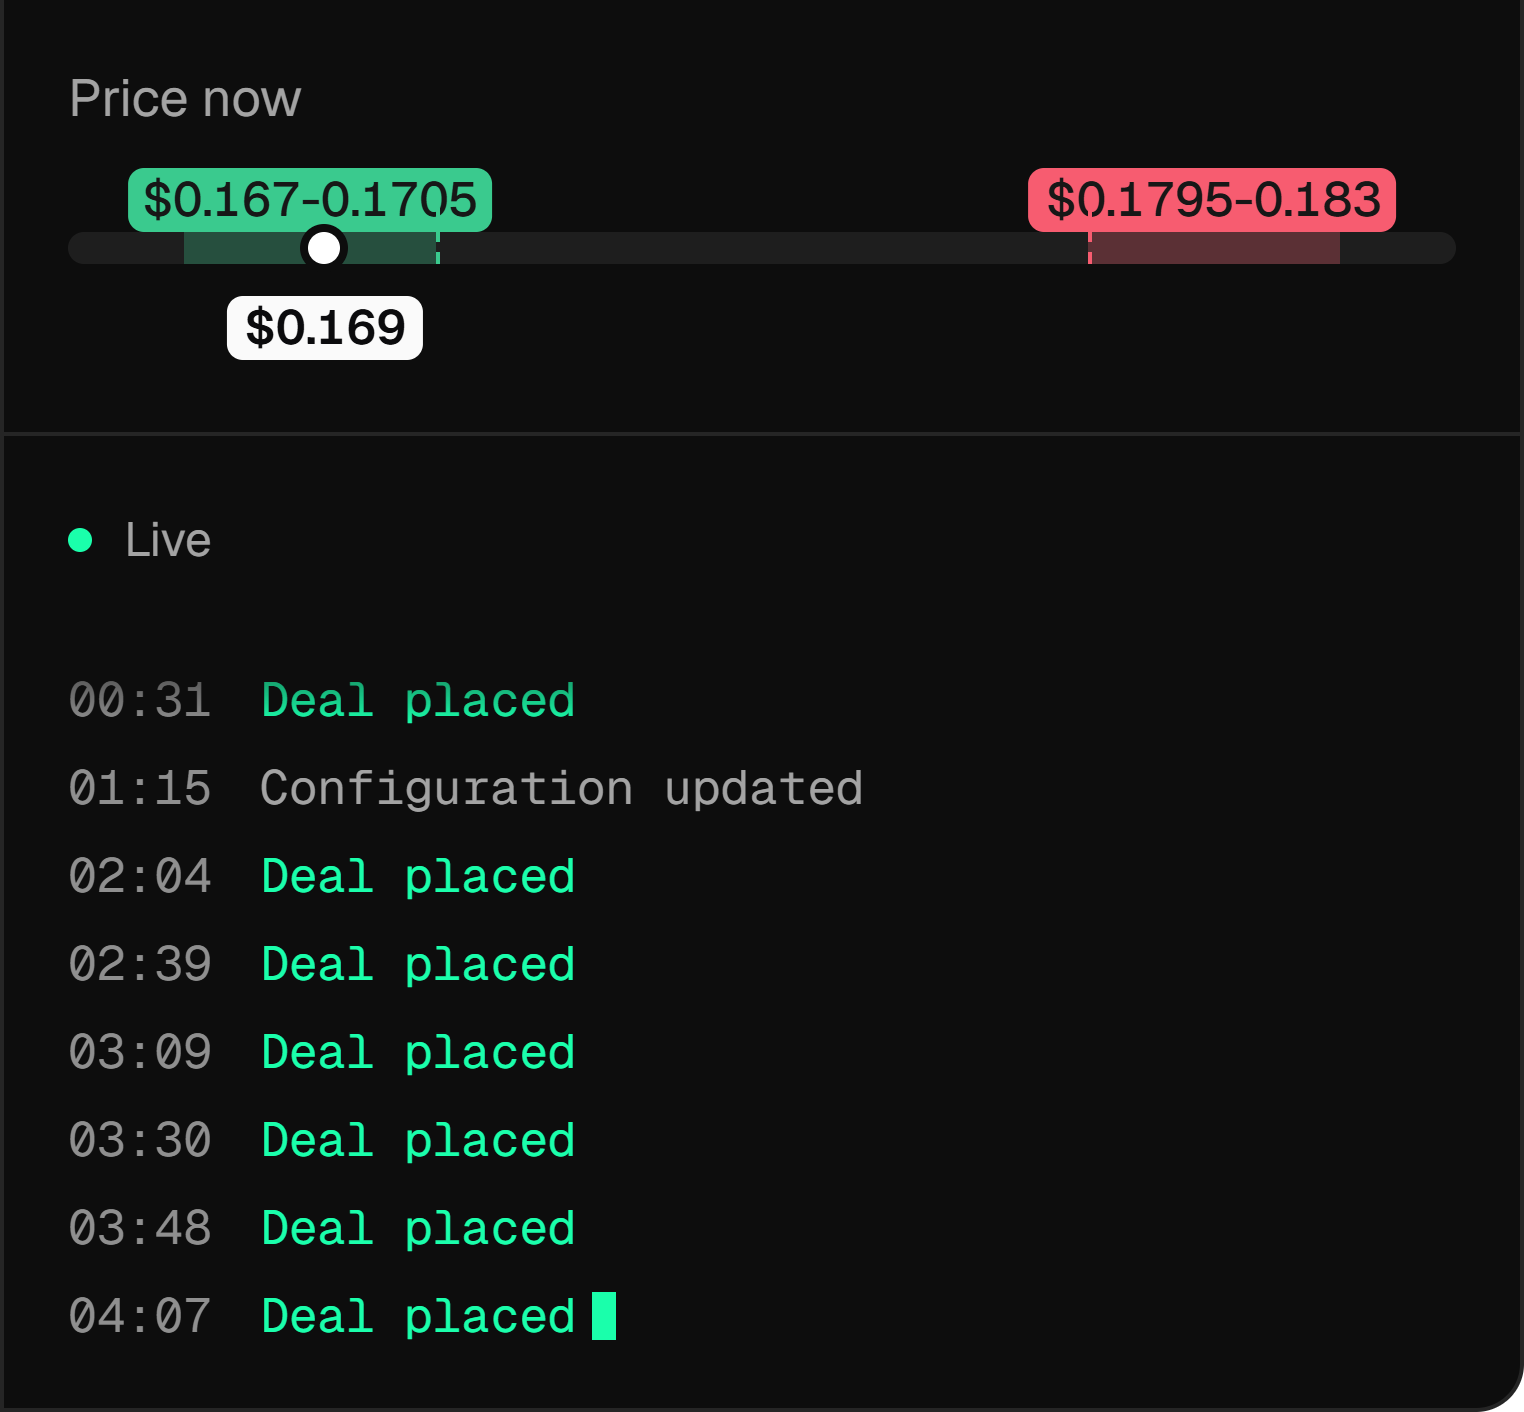
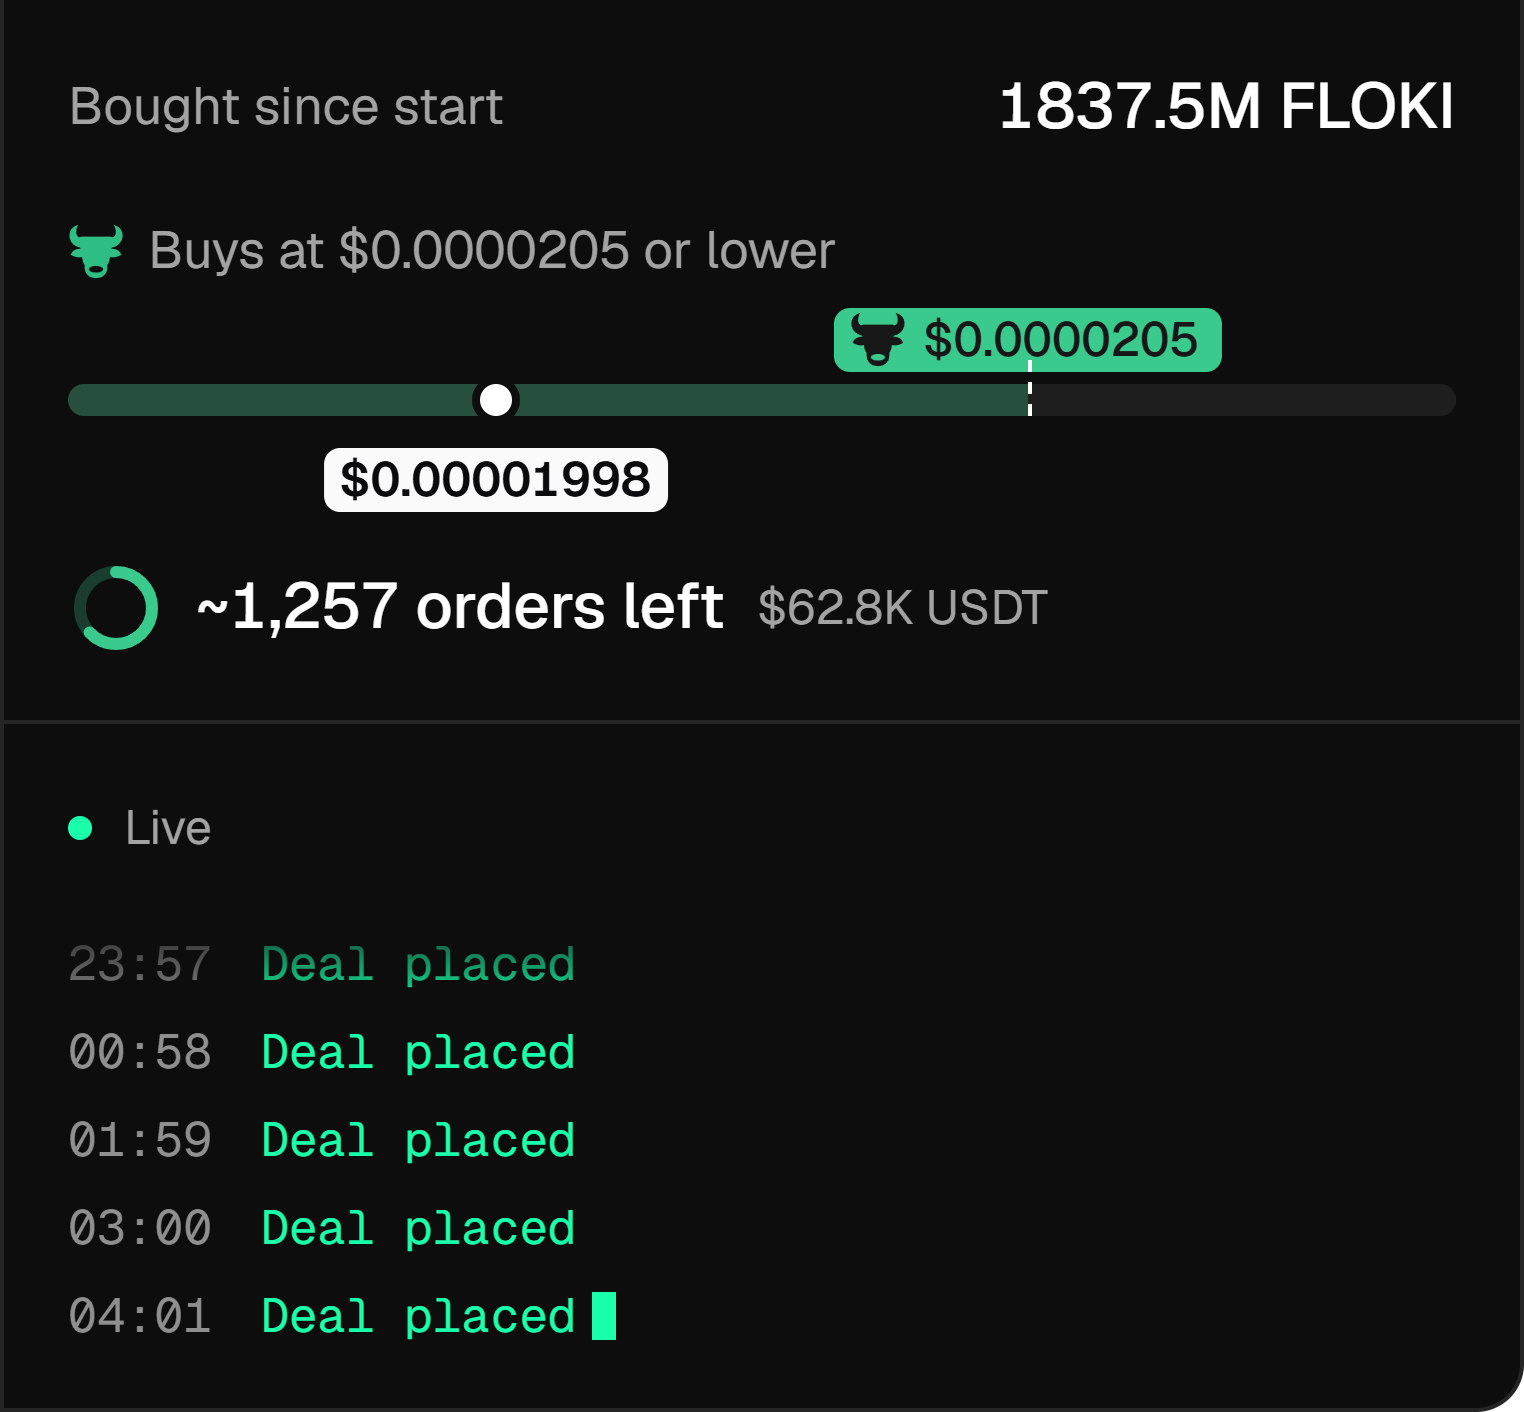
All three agent types share one widget with a preset for each. Spread & Depth shows what the agent adds against the target. Support Level shows its price levels against the price. Treasury Building shows how far it's got.
The agent's orders sit next to everyone else's, with a mark where it started, so you can see its share of the book. A short log sits beside the chart.
In October I rebuilt these widgets on the same pattern as Spread and Depth, so every chart in the product reads the same way.
What I'd measure.
Overview is a diagnosis: the team sees what's wrong with its market and starts an agent to fix it.
So I'd count the teams with a number out of target, like a spread far above it, and how many of them start the agent that fixes it. If they see the problem and start nothing, the diagnosis isn't clear enough, and that's where I'd work next.
On the agent page I'd watch one thing: do teams keep opening it after the first week. If they stop, the widget isn't showing them anything new.